White/Caucasian vs Uruguayan Median Female Earnings
COMPARE
White/Caucasian
Uruguayan
Median Female Earnings
Median Female Earnings Comparison
Whites/Caucasians
Uruguayans
$37,531
MEDIAN FEMALE EARNINGS
1.1/ 100
METRIC RATING
254th/ 347
METRIC RANK
$39,228
MEDIAN FEMALE EARNINGS
27.3/ 100
METRIC RATING
195th/ 347
METRIC RANK
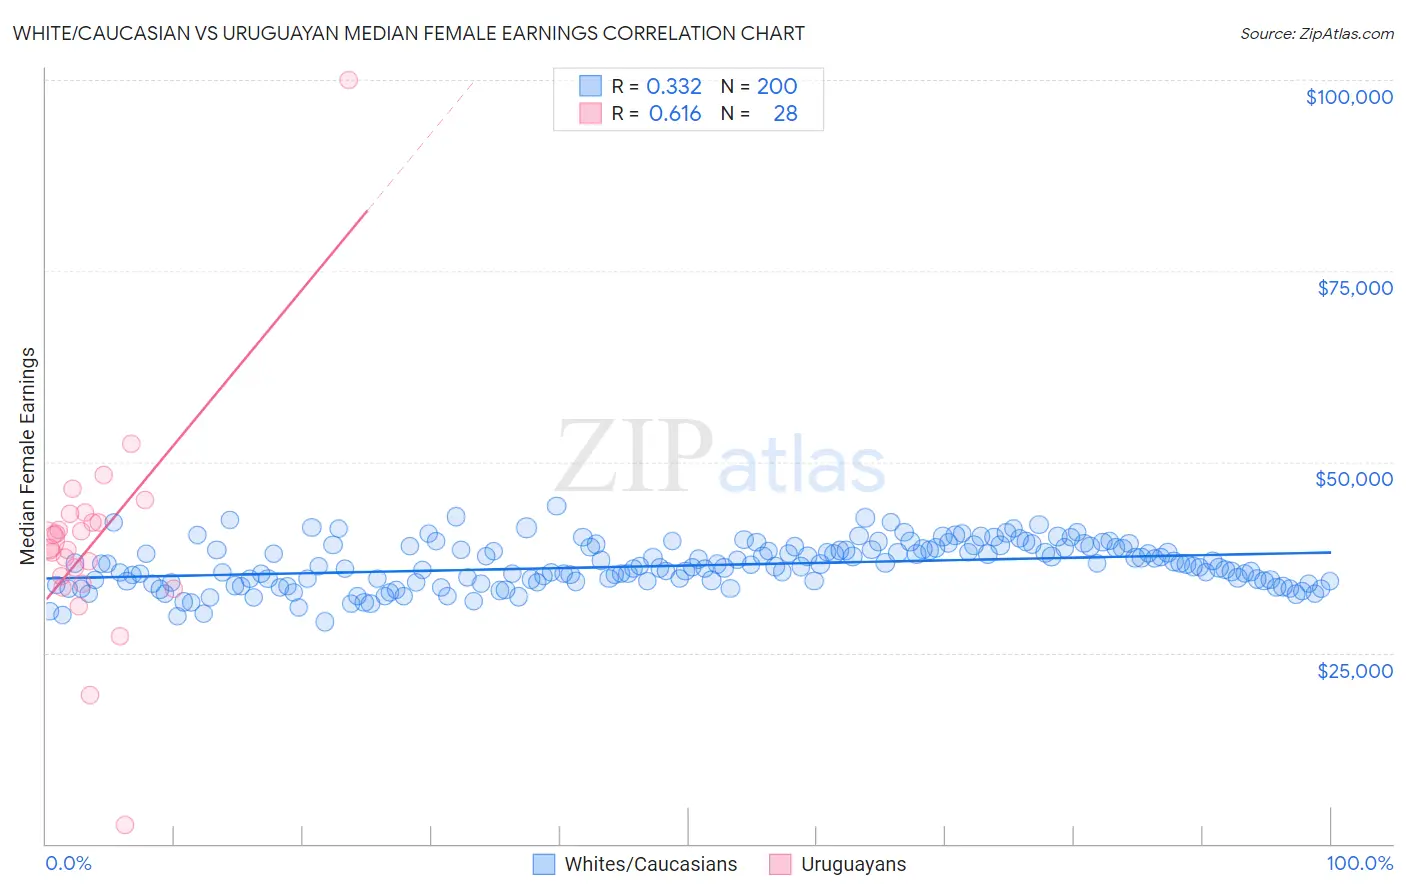
White/Caucasian vs Uruguayan Median Female Earnings Correlation Chart
The statistical analysis conducted on geographies consisting of 581,839,033 people shows a mild positive correlation between the proportion of Whites/Caucasians and median female earnings in the United States with a correlation coefficient (R) of 0.332 and weighted average of $37,531. Similarly, the statistical analysis conducted on geographies consisting of 144,779,017 people shows a significant positive correlation between the proportion of Uruguayans and median female earnings in the United States with a correlation coefficient (R) of 0.616 and weighted average of $39,228, a difference of 4.5%.
Median Female Earnings Correlation Summary
| Measurement | White/Caucasian | Uruguayan |
| Minimum | $29,061 | $2,499 |
| Maximum | $44,249 | $100,000 |
| Range | $15,187 | $97,501 |
| Mean | $36,445 | $39,566 |
| Median | $36,298 | $39,168 |
| Interquartile 25% (IQ1) | $34,375 | $34,578 |
| Interquartile 75% (IQ3) | $38,681 | $42,658 |
| Interquartile Range (IQR) | $4,306 | $8,081 |
| Standard Deviation (Sample) | $2,956 | $15,119 |
| Standard Deviation (Population) | $2,949 | $14,847 |
Similar Demographics by Median Female Earnings
Demographics Similar to Whites/Caucasians by Median Female Earnings
In terms of median female earnings, the demographic groups most similar to Whites/Caucasians are Colville ($37,514, a difference of 0.040%), Samoan ($37,498, a difference of 0.090%), Hawaiian ($37,497, a difference of 0.090%), Belizean ($37,429, a difference of 0.27%), and Scotch-Irish ($37,383, a difference of 0.39%).
| Demographics | Rating | Rank | Median Female Earnings |
| Immigrants | Somalia | 2.4 /100 | #247 | Tragic $37,914 |
| Alaskan Athabascans | 2.3 /100 | #248 | Tragic $37,905 |
| Swiss | 2.3 /100 | #249 | Tragic $37,904 |
| Immigrants | Iraq | 2.2 /100 | #250 | Tragic $37,864 |
| Welsh | 2.1 /100 | #251 | Tragic $37,856 |
| Immigrants | Dominica | 2.0 /100 | #252 | Tragic $37,825 |
| Danes | 1.6 /100 | #253 | Tragic $37,730 |
| Whites/Caucasians | 1.1 /100 | #254 | Tragic $37,531 |
| Colville | 1.1 /100 | #255 | Tragic $37,514 |
| Samoans | 1.0 /100 | #256 | Tragic $37,498 |
| Hawaiians | 1.0 /100 | #257 | Tragic $37,497 |
| Belizeans | 0.9 /100 | #258 | Tragic $37,429 |
| Scotch-Irish | 0.8 /100 | #259 | Tragic $37,383 |
| Dutch | 0.7 /100 | #260 | Tragic $37,339 |
| Malaysians | 0.7 /100 | #261 | Tragic $37,298 |
Demographics Similar to Uruguayans by Median Female Earnings
In terms of median female earnings, the demographic groups most similar to Uruguayans are Immigrants from Costa Rica ($39,186, a difference of 0.11%), Irish ($39,291, a difference of 0.16%), Immigrants from Nigeria ($39,294, a difference of 0.17%), Assyrian/Chaldean/Syriac ($39,159, a difference of 0.17%), and Immigrants ($39,328, a difference of 0.26%).
| Demographics | Rating | Rank | Median Female Earnings |
| Bermudans | 35.9 /100 | #188 | Fair $39,418 |
| Senegalese | 34.2 /100 | #189 | Fair $39,384 |
| Puget Sound Salish | 33.9 /100 | #190 | Fair $39,376 |
| Immigrants | Western Africa | 32.7 /100 | #191 | Fair $39,351 |
| Immigrants | Immigrants | 31.7 /100 | #192 | Fair $39,328 |
| Immigrants | Nigeria | 30.2 /100 | #193 | Fair $39,294 |
| Irish | 30.0 /100 | #194 | Fair $39,291 |
| Uruguayans | 27.3 /100 | #195 | Fair $39,228 |
| Immigrants | Costa Rica | 25.6 /100 | #196 | Fair $39,186 |
| Assyrians/Chaldeans/Syriacs | 24.6 /100 | #197 | Fair $39,159 |
| Ecuadorians | 23.0 /100 | #198 | Fair $39,117 |
| Icelanders | 22.7 /100 | #199 | Fair $39,109 |
| Immigrants | Panama | 20.6 /100 | #200 | Fair $39,049 |
| Panamanians | 20.6 /100 | #201 | Fair $39,049 |
| Slovaks | 19.9 /100 | #202 | Poor $39,029 |