Brazilian vs Uruguayan Median Female Earnings
COMPARE
Brazilian
Uruguayan
Median Female Earnings
Median Female Earnings Comparison
Brazilians
Uruguayans
$40,483
MEDIAN FEMALE EARNINGS
83.6/ 100
METRIC RATING
145th/ 347
METRIC RANK
$39,228
MEDIAN FEMALE EARNINGS
27.3/ 100
METRIC RATING
195th/ 347
METRIC RANK
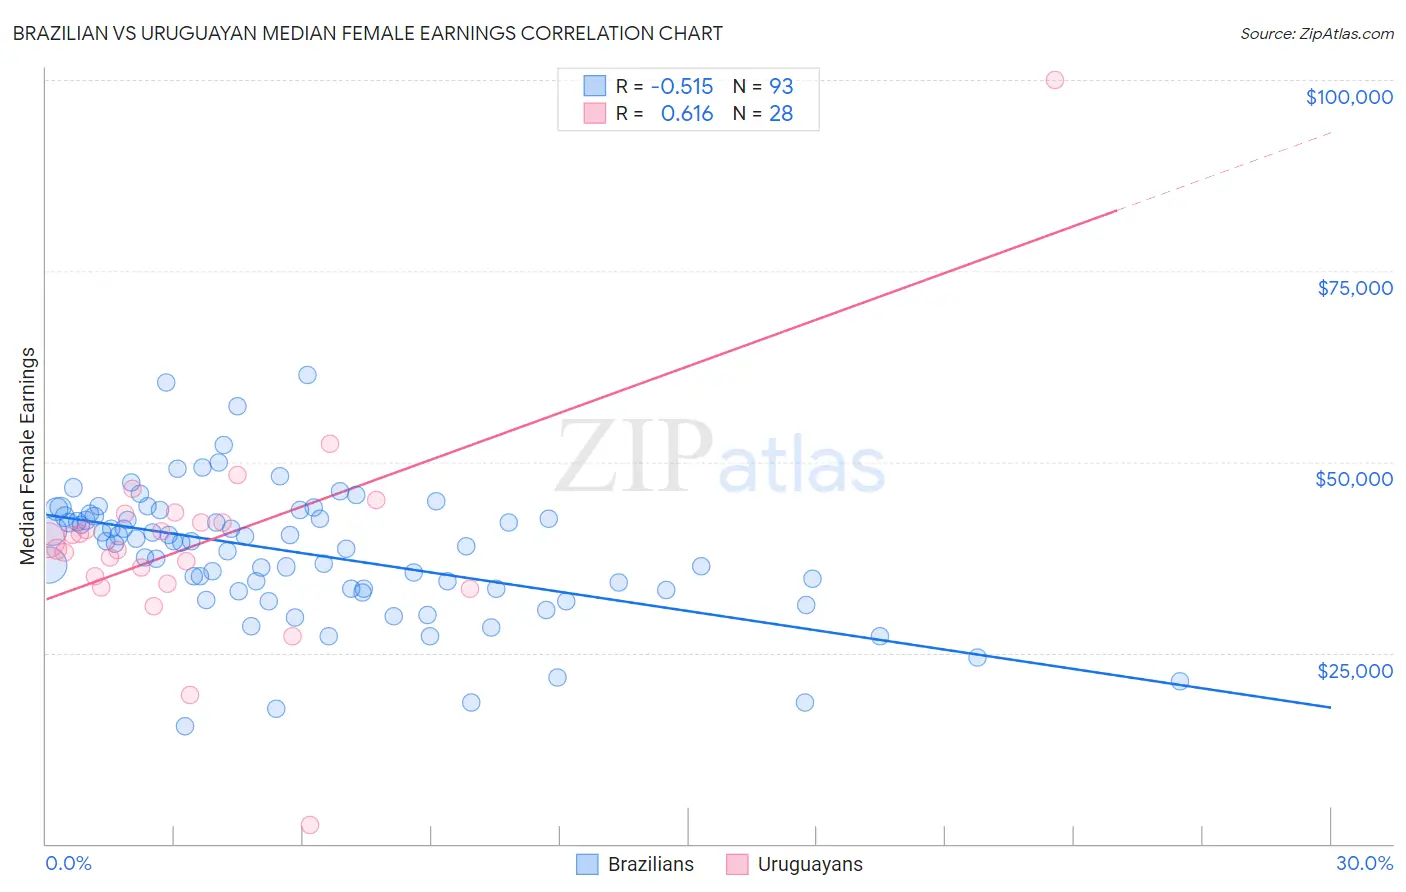
Brazilian vs Uruguayan Median Female Earnings Correlation Chart
The statistical analysis conducted on geographies consisting of 323,890,405 people shows a substantial negative correlation between the proportion of Brazilians and median female earnings in the United States with a correlation coefficient (R) of -0.515 and weighted average of $40,483. Similarly, the statistical analysis conducted on geographies consisting of 144,779,017 people shows a significant positive correlation between the proportion of Uruguayans and median female earnings in the United States with a correlation coefficient (R) of 0.616 and weighted average of $39,228, a difference of 3.2%.
Median Female Earnings Correlation Summary
| Measurement | Brazilian | Uruguayan |
| Minimum | $15,384 | $2,499 |
| Maximum | $61,398 | $100,000 |
| Range | $46,014 | $97,501 |
| Mean | $38,053 | $39,566 |
| Median | $39,528 | $39,168 |
| Interquartile 25% (IQ1) | $33,268 | $34,578 |
| Interquartile 75% (IQ3) | $42,843 | $42,658 |
| Interquartile Range (IQR) | $9,575 | $8,081 |
| Standard Deviation (Sample) | $8,528 | $15,119 |
| Standard Deviation (Population) | $8,482 | $14,847 |
Similar Demographics by Median Female Earnings
Demographics Similar to Brazilians by Median Female Earnings
In terms of median female earnings, the demographic groups most similar to Brazilians are Immigrants from North Macedonia ($40,488, a difference of 0.010%), Northern European ($40,491, a difference of 0.020%), Sri Lankan ($40,496, a difference of 0.030%), Immigrants from Syria ($40,499, a difference of 0.040%), and Ghanaian ($40,429, a difference of 0.13%).
| Demographics | Rating | Rank | Median Female Earnings |
| Taiwanese | 86.1 /100 | #138 | Excellent $40,576 |
| Immigrants | South Eastern Asia | 85.7 /100 | #139 | Excellent $40,558 |
| Serbians | 85.2 /100 | #140 | Excellent $40,539 |
| Immigrants | Syria | 84.1 /100 | #141 | Excellent $40,499 |
| Sri Lankans | 84.0 /100 | #142 | Excellent $40,496 |
| Northern Europeans | 83.9 /100 | #143 | Excellent $40,491 |
| Immigrants | North Macedonia | 83.8 /100 | #144 | Excellent $40,488 |
| Brazilians | 83.6 /100 | #145 | Excellent $40,483 |
| Ghanaians | 82.1 /100 | #146 | Excellent $40,429 |
| Vietnamese | 80.4 /100 | #147 | Excellent $40,377 |
| Poles | 80.2 /100 | #148 | Excellent $40,371 |
| Immigrants | Cameroon | 79.7 /100 | #149 | Good $40,354 |
| Immigrants | Chile | 79.6 /100 | #150 | Good $40,353 |
| Immigrants | Armenia | 79.2 /100 | #151 | Good $40,340 |
| West Indians | 78.4 /100 | #152 | Good $40,317 |
Demographics Similar to Uruguayans by Median Female Earnings
In terms of median female earnings, the demographic groups most similar to Uruguayans are Immigrants from Costa Rica ($39,186, a difference of 0.11%), Irish ($39,291, a difference of 0.16%), Immigrants from Nigeria ($39,294, a difference of 0.17%), Assyrian/Chaldean/Syriac ($39,159, a difference of 0.17%), and Immigrants ($39,328, a difference of 0.26%).
| Demographics | Rating | Rank | Median Female Earnings |
| Bermudans | 35.9 /100 | #188 | Fair $39,418 |
| Senegalese | 34.2 /100 | #189 | Fair $39,384 |
| Puget Sound Salish | 33.9 /100 | #190 | Fair $39,376 |
| Immigrants | Western Africa | 32.7 /100 | #191 | Fair $39,351 |
| Immigrants | Immigrants | 31.7 /100 | #192 | Fair $39,328 |
| Immigrants | Nigeria | 30.2 /100 | #193 | Fair $39,294 |
| Irish | 30.0 /100 | #194 | Fair $39,291 |
| Uruguayans | 27.3 /100 | #195 | Fair $39,228 |
| Immigrants | Costa Rica | 25.6 /100 | #196 | Fair $39,186 |
| Assyrians/Chaldeans/Syriacs | 24.6 /100 | #197 | Fair $39,159 |
| Ecuadorians | 23.0 /100 | #198 | Fair $39,117 |
| Icelanders | 22.7 /100 | #199 | Fair $39,109 |
| Immigrants | Panama | 20.6 /100 | #200 | Fair $39,049 |
| Panamanians | 20.6 /100 | #201 | Fair $39,049 |
| Slovaks | 19.9 /100 | #202 | Poor $39,029 |