Spaniard vs Alaska Native Median Female Earnings
COMPARE
Spaniard
Alaska Native
Median Female Earnings
Median Female Earnings Comparison
Spaniards
Alaska Natives
$38,656
MEDIAN FEMALE EARNINGS
10.3/ 100
METRIC RATING
215th/ 347
METRIC RANK
$38,202
MEDIAN FEMALE EARNINGS
4.3/ 100
METRIC RATING
238th/ 347
METRIC RANK
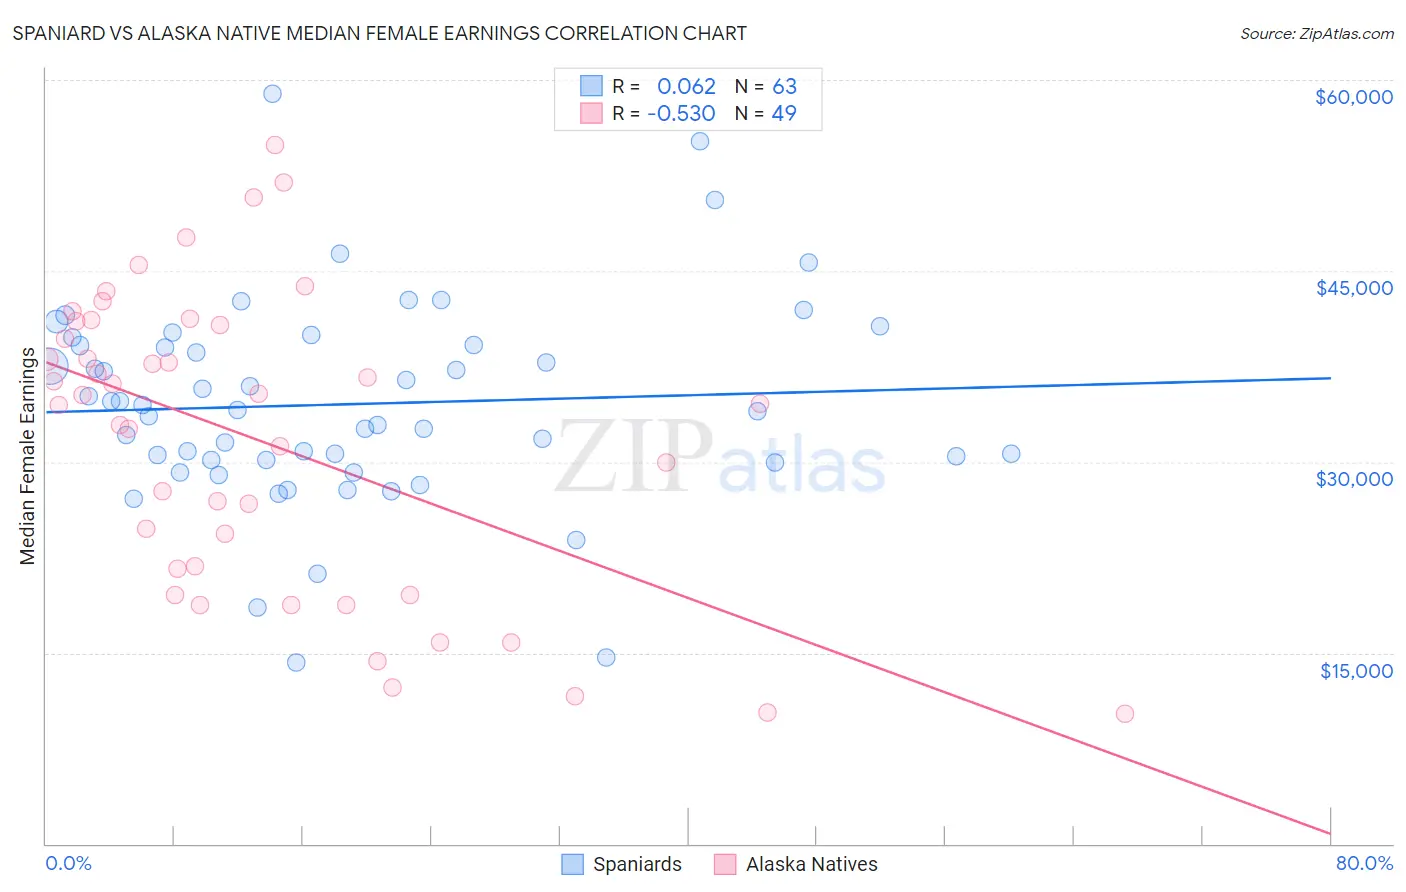
Spaniard vs Alaska Native Median Female Earnings Correlation Chart
The statistical analysis conducted on geographies consisting of 443,223,610 people shows a slight positive correlation between the proportion of Spaniards and median female earnings in the United States with a correlation coefficient (R) of 0.062 and weighted average of $38,656. Similarly, the statistical analysis conducted on geographies consisting of 76,744,414 people shows a substantial negative correlation between the proportion of Alaska Natives and median female earnings in the United States with a correlation coefficient (R) of -0.530 and weighted average of $38,202, a difference of 1.2%.
Median Female Earnings Correlation Summary
| Measurement | Spaniard | Alaska Native |
| Minimum | $14,192 | $10,250 |
| Maximum | $58,909 | $54,922 |
| Range | $44,717 | $44,672 |
| Mean | $34,527 | $31,635 |
| Median | $34,038 | $34,583 |
| Interquartile 25% (IQ1) | $30,169 | $20,573 |
| Interquartile 75% (IQ3) | $39,139 | $40,922 |
| Interquartile Range (IQR) | $8,970 | $20,349 |
| Standard Deviation (Sample) | $8,078 | $11,761 |
| Standard Deviation (Population) | $8,014 | $11,640 |
Similar Demographics by Median Female Earnings
Demographics Similar to Spaniards by Median Female Earnings
In terms of median female earnings, the demographic groups most similar to Spaniards are Iraqi ($38,666, a difference of 0.020%), Jamaican ($38,670, a difference of 0.030%), Immigrants from Ecuador ($38,644, a difference of 0.030%), Immigrants from Jamaica ($38,625, a difference of 0.080%), and Cape Verdean ($38,614, a difference of 0.11%).
| Demographics | Rating | Rank | Median Female Earnings |
| Immigrants | Thailand | 13.6 /100 | #208 | Poor $38,810 |
| Norwegians | 13.4 /100 | #209 | Poor $38,802 |
| Czechoslovakians | 12.0 /100 | #210 | Poor $38,738 |
| Aleuts | 11.6 /100 | #211 | Poor $38,719 |
| Guamanians/Chamorros | 11.5 /100 | #212 | Poor $38,717 |
| Jamaicans | 10.5 /100 | #213 | Poor $38,670 |
| Iraqis | 10.5 /100 | #214 | Poor $38,666 |
| Spaniards | 10.3 /100 | #215 | Poor $38,656 |
| Immigrants | Ecuador | 10.1 /100 | #216 | Poor $38,644 |
| Immigrants | Jamaica | 9.7 /100 | #217 | Tragic $38,625 |
| Cape Verdeans | 9.5 /100 | #218 | Tragic $38,614 |
| Nepalese | 9.3 /100 | #219 | Tragic $38,603 |
| Yugoslavians | 8.8 /100 | #220 | Tragic $38,573 |
| Immigrants | Azores | 8.8 /100 | #221 | Tragic $38,573 |
| Japanese | 8.1 /100 | #222 | Tragic $38,528 |
Demographics Similar to Alaska Natives by Median Female Earnings
In terms of median female earnings, the demographic groups most similar to Alaska Natives are Immigrants from Cabo Verde ($38,208, a difference of 0.020%), English ($38,196, a difference of 0.020%), Liberian ($38,215, a difference of 0.030%), Sudanese ($38,215, a difference of 0.040%), and Finnish ($38,173, a difference of 0.080%).
| Demographics | Rating | Rank | Median Female Earnings |
| Somalis | 5.5 /100 | #231 | Tragic $38,333 |
| Scandinavians | 5.2 /100 | #232 | Tragic $38,306 |
| Tongans | 5.1 /100 | #233 | Tragic $38,288 |
| Celtics | 5.0 /100 | #234 | Tragic $38,283 |
| Sudanese | 4.4 /100 | #235 | Tragic $38,215 |
| Liberians | 4.4 /100 | #236 | Tragic $38,215 |
| Immigrants | Cabo Verde | 4.3 /100 | #237 | Tragic $38,208 |
| Alaska Natives | 4.3 /100 | #238 | Tragic $38,202 |
| English | 4.2 /100 | #239 | Tragic $38,196 |
| Finns | 4.0 /100 | #240 | Tragic $38,173 |
| Spanish | 3.5 /100 | #241 | Tragic $38,098 |
| Immigrants | Burma/Myanmar | 3.0 /100 | #242 | Tragic $38,028 |
| Germans | 2.8 /100 | #243 | Tragic $37,986 |
| Immigrants | Liberia | 2.7 /100 | #244 | Tragic $37,970 |
| Immigrants | Middle Africa | 2.7 /100 | #245 | Tragic $37,965 |