Spaniard vs Immigrants from North America Median Female Earnings
COMPARE
Spaniard
Immigrants from North America
Median Female Earnings
Median Female Earnings Comparison
Spaniards
Immigrants from North America
$38,656
MEDIAN FEMALE EARNINGS
10.3/ 100
METRIC RATING
215th/ 347
METRIC RANK
$41,319
MEDIAN FEMALE EARNINGS
96.7/ 100
METRIC RATING
112th/ 347
METRIC RANK
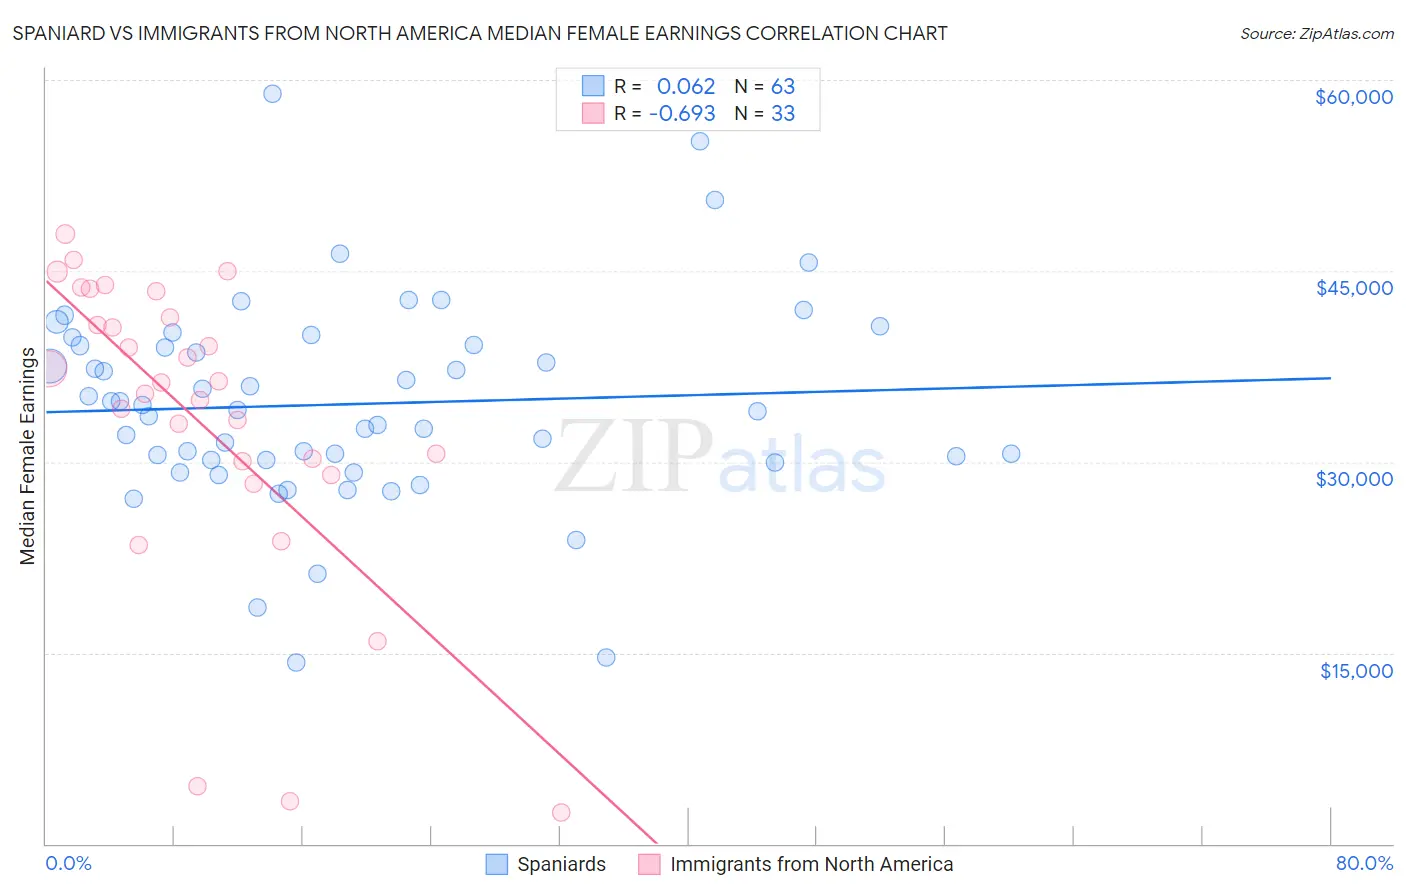
Spaniard vs Immigrants from North America Median Female Earnings Correlation Chart
The statistical analysis conducted on geographies consisting of 443,223,610 people shows a slight positive correlation between the proportion of Spaniards and median female earnings in the United States with a correlation coefficient (R) of 0.062 and weighted average of $38,656. Similarly, the statistical analysis conducted on geographies consisting of 462,086,595 people shows a significant negative correlation between the proportion of Immigrants from North America and median female earnings in the United States with a correlation coefficient (R) of -0.693 and weighted average of $41,319, a difference of 6.9%.
Median Female Earnings Correlation Summary
| Measurement | Spaniard | Immigrants from North America |
| Minimum | $14,192 | $2,499 |
| Maximum | $58,909 | $47,877 |
| Range | $44,717 | $45,378 |
| Mean | $34,527 | $33,312 |
| Median | $34,038 | $36,283 |
| Interquartile 25% (IQ1) | $30,169 | $29,495 |
| Interquartile 75% (IQ3) | $39,139 | $42,384 |
| Interquartile Range (IQR) | $8,970 | $12,888 |
| Standard Deviation (Sample) | $8,078 | $12,008 |
| Standard Deviation (Population) | $8,014 | $11,825 |
Similar Demographics by Median Female Earnings
Demographics Similar to Spaniards by Median Female Earnings
In terms of median female earnings, the demographic groups most similar to Spaniards are Iraqi ($38,666, a difference of 0.020%), Jamaican ($38,670, a difference of 0.030%), Immigrants from Ecuador ($38,644, a difference of 0.030%), Immigrants from Jamaica ($38,625, a difference of 0.080%), and Cape Verdean ($38,614, a difference of 0.11%).
| Demographics | Rating | Rank | Median Female Earnings |
| Immigrants | Thailand | 13.6 /100 | #208 | Poor $38,810 |
| Norwegians | 13.4 /100 | #209 | Poor $38,802 |
| Czechoslovakians | 12.0 /100 | #210 | Poor $38,738 |
| Aleuts | 11.6 /100 | #211 | Poor $38,719 |
| Guamanians/Chamorros | 11.5 /100 | #212 | Poor $38,717 |
| Jamaicans | 10.5 /100 | #213 | Poor $38,670 |
| Iraqis | 10.5 /100 | #214 | Poor $38,666 |
| Spaniards | 10.3 /100 | #215 | Poor $38,656 |
| Immigrants | Ecuador | 10.1 /100 | #216 | Poor $38,644 |
| Immigrants | Jamaica | 9.7 /100 | #217 | Tragic $38,625 |
| Cape Verdeans | 9.5 /100 | #218 | Tragic $38,614 |
| Nepalese | 9.3 /100 | #219 | Tragic $38,603 |
| Yugoslavians | 8.8 /100 | #220 | Tragic $38,573 |
| Immigrants | Azores | 8.8 /100 | #221 | Tragic $38,573 |
| Japanese | 8.1 /100 | #222 | Tragic $38,528 |
Demographics Similar to Immigrants from North America by Median Female Earnings
In terms of median female earnings, the demographic groups most similar to Immigrants from North America are Macedonian ($41,286, a difference of 0.080%), Immigrants from England ($41,277, a difference of 0.10%), Korean ($41,276, a difference of 0.10%), Immigrants from Brazil ($41,273, a difference of 0.11%), and Immigrants from Canada ($41,373, a difference of 0.13%).
| Demographics | Rating | Rank | Median Female Earnings |
| Italians | 97.7 /100 | #105 | Exceptional $41,505 |
| Immigrants | Eritrea | 97.6 /100 | #106 | Exceptional $41,485 |
| Palestinians | 97.6 /100 | #107 | Exceptional $41,484 |
| Jordanians | 97.5 /100 | #108 | Exceptional $41,464 |
| Chinese | 97.5 /100 | #109 | Exceptional $41,461 |
| Immigrants | Western Asia | 97.0 /100 | #110 | Exceptional $41,375 |
| Immigrants | Canada | 97.0 /100 | #111 | Exceptional $41,373 |
| Immigrants | North America | 96.7 /100 | #112 | Exceptional $41,319 |
| Macedonians | 96.4 /100 | #113 | Exceptional $41,286 |
| Immigrants | England | 96.4 /100 | #114 | Exceptional $41,277 |
| Koreans | 96.4 /100 | #115 | Exceptional $41,276 |
| Immigrants | Brazil | 96.4 /100 | #116 | Exceptional $41,273 |
| Barbadians | 96.3 /100 | #117 | Exceptional $41,261 |
| Immigrants | Lebanon | 95.6 /100 | #118 | Exceptional $41,183 |
| Immigrants | Philippines | 95.0 /100 | #119 | Exceptional $41,114 |