Spaniard vs Indonesian Median Female Earnings
COMPARE
Spaniard
Indonesian
Median Female Earnings
Median Female Earnings Comparison
Spaniards
Indonesians
$38,656
MEDIAN FEMALE EARNINGS
10.3/ 100
METRIC RATING
215th/ 347
METRIC RANK
$36,140
MEDIAN FEMALE EARNINGS
0.1/ 100
METRIC RATING
284th/ 347
METRIC RANK
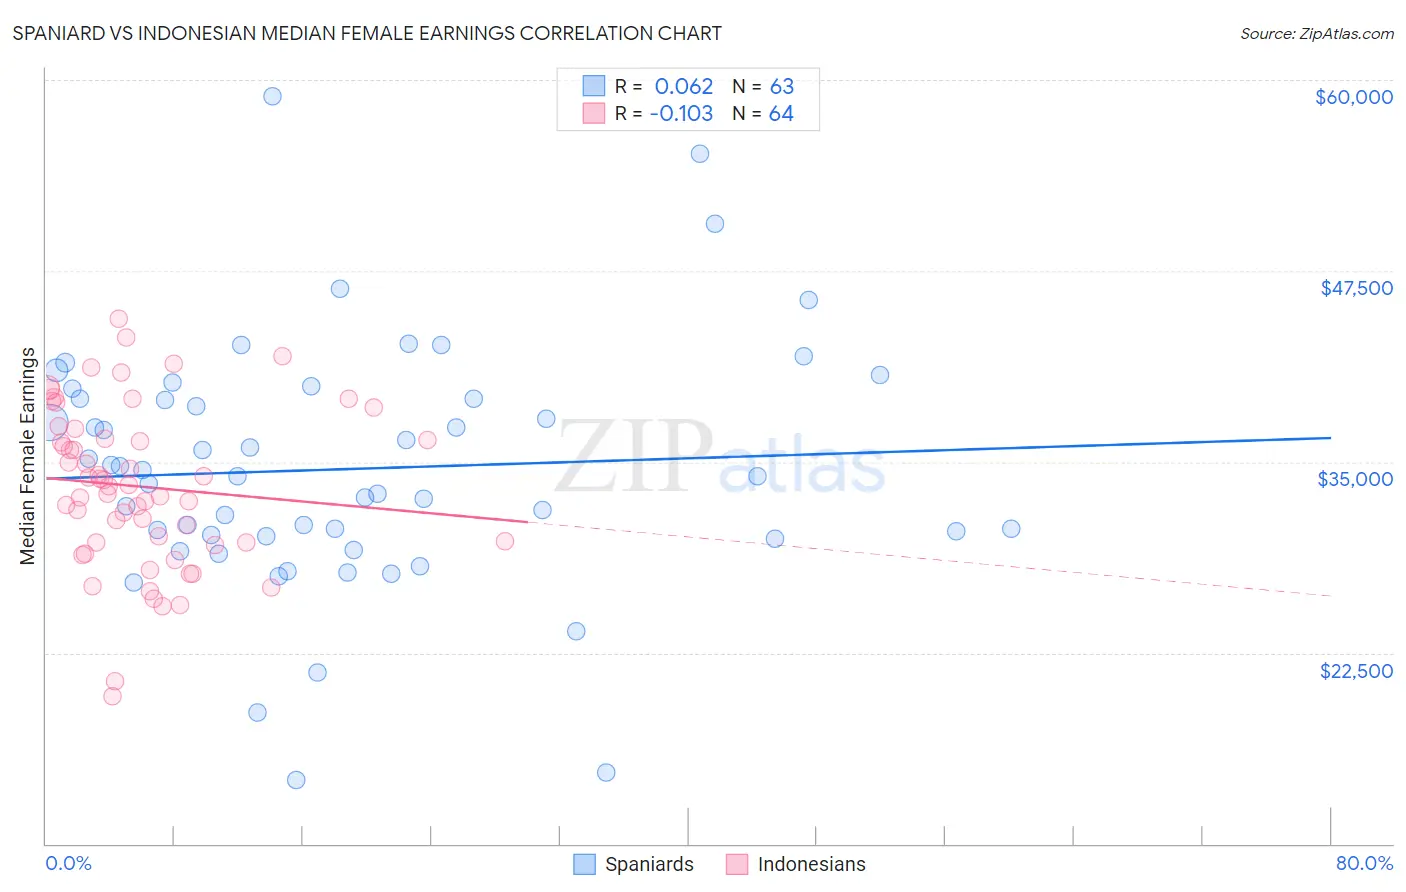
Spaniard vs Indonesian Median Female Earnings Correlation Chart
The statistical analysis conducted on geographies consisting of 443,223,610 people shows a slight positive correlation between the proportion of Spaniards and median female earnings in the United States with a correlation coefficient (R) of 0.062 and weighted average of $38,656. Similarly, the statistical analysis conducted on geographies consisting of 162,730,900 people shows a poor negative correlation between the proportion of Indonesians and median female earnings in the United States with a correlation coefficient (R) of -0.103 and weighted average of $36,140, a difference of 7.0%.
Median Female Earnings Correlation Summary
| Measurement | Spaniard | Indonesian |
| Minimum | $14,192 | $19,686 |
| Maximum | $58,909 | $44,373 |
| Range | $44,717 | $24,687 |
| Mean | $34,527 | $33,375 |
| Median | $34,038 | $33,447 |
| Interquartile 25% (IQ1) | $30,169 | $29,712 |
| Interquartile 75% (IQ3) | $39,139 | $36,850 |
| Interquartile Range (IQR) | $8,970 | $7,138 |
| Standard Deviation (Sample) | $8,078 | $5,258 |
| Standard Deviation (Population) | $8,014 | $5,217 |
Similar Demographics by Median Female Earnings
Demographics Similar to Spaniards by Median Female Earnings
In terms of median female earnings, the demographic groups most similar to Spaniards are Iraqi ($38,666, a difference of 0.020%), Jamaican ($38,670, a difference of 0.030%), Immigrants from Ecuador ($38,644, a difference of 0.030%), Immigrants from Jamaica ($38,625, a difference of 0.080%), and Cape Verdean ($38,614, a difference of 0.11%).
| Demographics | Rating | Rank | Median Female Earnings |
| Immigrants | Thailand | 13.6 /100 | #208 | Poor $38,810 |
| Norwegians | 13.4 /100 | #209 | Poor $38,802 |
| Czechoslovakians | 12.0 /100 | #210 | Poor $38,738 |
| Aleuts | 11.6 /100 | #211 | Poor $38,719 |
| Guamanians/Chamorros | 11.5 /100 | #212 | Poor $38,717 |
| Jamaicans | 10.5 /100 | #213 | Poor $38,670 |
| Iraqis | 10.5 /100 | #214 | Poor $38,666 |
| Spaniards | 10.3 /100 | #215 | Poor $38,656 |
| Immigrants | Ecuador | 10.1 /100 | #216 | Poor $38,644 |
| Immigrants | Jamaica | 9.7 /100 | #217 | Tragic $38,625 |
| Cape Verdeans | 9.5 /100 | #218 | Tragic $38,614 |
| Nepalese | 9.3 /100 | #219 | Tragic $38,603 |
| Yugoslavians | 8.8 /100 | #220 | Tragic $38,573 |
| Immigrants | Azores | 8.8 /100 | #221 | Tragic $38,573 |
| Japanese | 8.1 /100 | #222 | Tragic $38,528 |
Demographics Similar to Indonesians by Median Female Earnings
In terms of median female earnings, the demographic groups most similar to Indonesians are Immigrants from Haiti ($36,203, a difference of 0.17%), Paiute ($36,056, a difference of 0.23%), Osage ($36,034, a difference of 0.29%), Immigrants from Nicaragua ($36,023, a difference of 0.33%), and Immigrants from Zaire ($36,017, a difference of 0.34%).
| Demographics | Rating | Rank | Median Female Earnings |
| Marshallese | 0.1 /100 | #277 | Tragic $36,459 |
| U.S. Virgin Islanders | 0.1 /100 | #278 | Tragic $36,424 |
| Immigrants | Caribbean | 0.1 /100 | #279 | Tragic $36,414 |
| Iroquois | 0.1 /100 | #280 | Tragic $36,408 |
| Spanish Americans | 0.1 /100 | #281 | Tragic $36,391 |
| Haitians | 0.1 /100 | #282 | Tragic $36,374 |
| Immigrants | Haiti | 0.1 /100 | #283 | Tragic $36,203 |
| Indonesians | 0.1 /100 | #284 | Tragic $36,140 |
| Paiute | 0.1 /100 | #285 | Tragic $36,056 |
| Osage | 0.0 /100 | #286 | Tragic $36,034 |
| Immigrants | Nicaragua | 0.0 /100 | #287 | Tragic $36,023 |
| Immigrants | Zaire | 0.0 /100 | #288 | Tragic $36,017 |
| Bangladeshis | 0.0 /100 | #289 | Tragic $35,960 |
| Central American Indians | 0.0 /100 | #290 | Tragic $35,930 |
| Blackfeet | 0.0 /100 | #291 | Tragic $35,864 |