Spaniard vs Uruguayan Unemployment Among Ages 30 to 34 years
COMPARE
Spaniard
Uruguayan
Unemployment Among Ages 30 to 34 years
Unemployment Among Ages 30 to 34 years Comparison
Spaniards
Uruguayans
5.8%
UNEMPLOYMENT AMONG AGES 30 TO 34 YEARS
3.2/ 100
METRIC RATING
222nd/ 347
METRIC RANK
5.2%
UNEMPLOYMENT AMONG AGES 30 TO 34 YEARS
95.4/ 100
METRIC RATING
77th/ 347
METRIC RANK
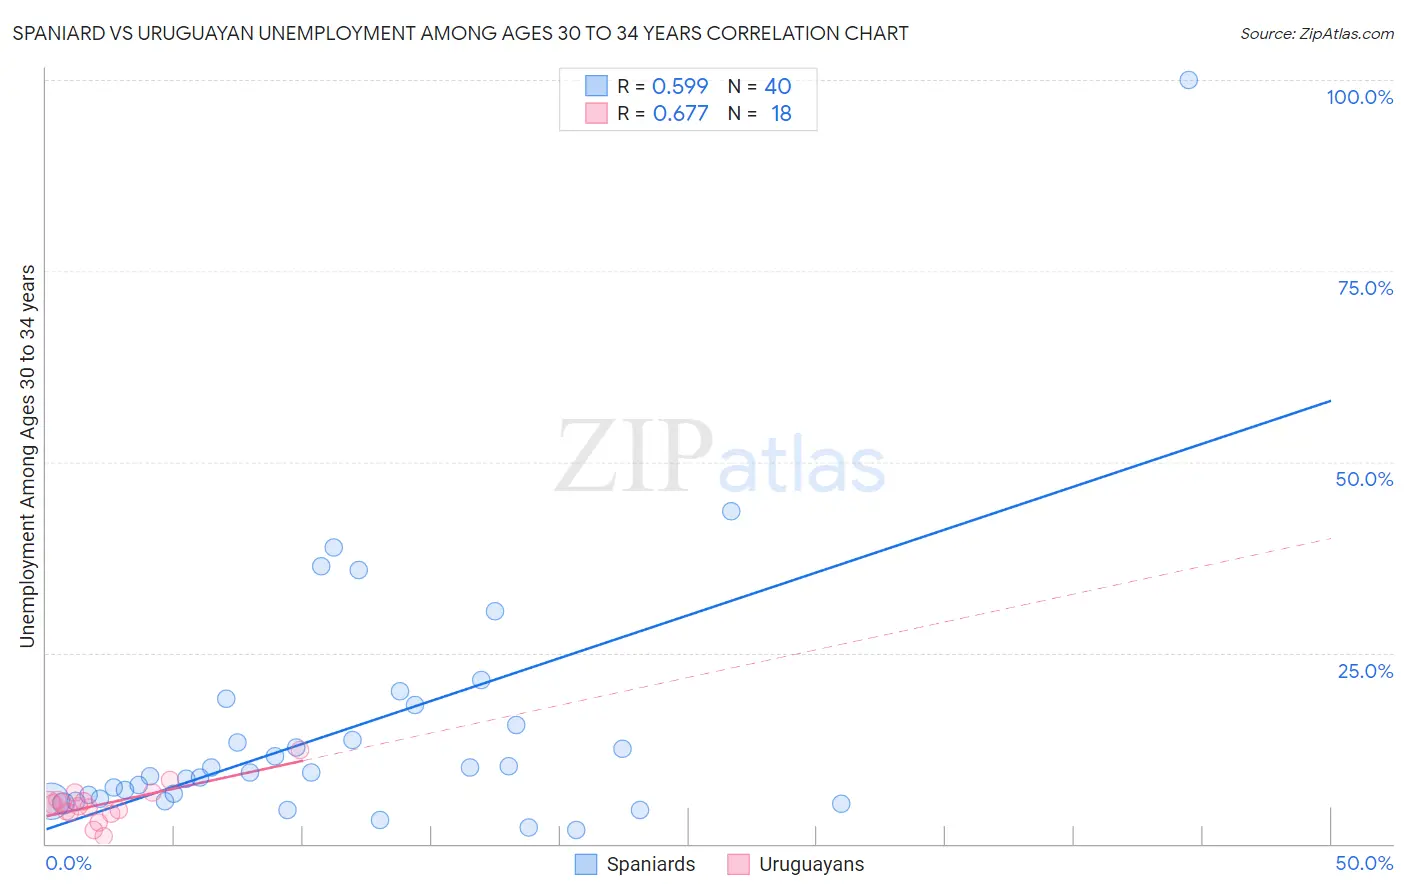
Spaniard vs Uruguayan Unemployment Among Ages 30 to 34 years Correlation Chart
The statistical analysis conducted on geographies consisting of 414,538,848 people shows a substantial positive correlation between the proportion of Spaniards and unemployment rate among population between the ages 30 and 34 in the United States with a correlation coefficient (R) of 0.599 and weighted average of 5.8%. Similarly, the statistical analysis conducted on geographies consisting of 141,854,413 people shows a significant positive correlation between the proportion of Uruguayans and unemployment rate among population between the ages 30 and 34 in the United States with a correlation coefficient (R) of 0.677 and weighted average of 5.2%, a difference of 11.8%.
Unemployment Among Ages 30 to 34 years Correlation Summary
| Measurement | Spaniard | Uruguayan |
| Minimum | 1.8% | 1.0% |
| Maximum | 100.0% | 12.3% |
| Range | 98.2% | 11.3% |
| Mean | 15.0% | 5.2% |
| Median | 9.4% | 5.0% |
| Interquartile 25% (IQ1) | 5.7% | 4.0% |
| Interquartile 75% (IQ3) | 16.9% | 5.7% |
| Interquartile Range (IQR) | 11.2% | 1.7% |
| Standard Deviation (Sample) | 17.3% | 2.5% |
| Standard Deviation (Population) | 17.1% | 2.4% |
Similar Demographics by Unemployment Among Ages 30 to 34 years
Demographics Similar to Spaniards by Unemployment Among Ages 30 to 34 years
In terms of unemployment among ages 30 to 34 years, the demographic groups most similar to Spaniards are Bermudan (5.8%, a difference of 0.26%), Guamanian/Chamorro (5.8%, a difference of 0.33%), Sierra Leonean (5.8%, a difference of 0.34%), Slovak (5.8%, a difference of 0.41%), and Samoan (5.8%, a difference of 0.44%).
| Demographics | Rating | Rank | Unemployment Among Ages 30 to 34 years |
| Immigrants | Cambodia | 5.8 /100 | #215 | Tragic 5.7% |
| Immigrants | Syria | 5.5 /100 | #216 | Tragic 5.7% |
| Immigrants | Fiji | 5.1 /100 | #217 | Tragic 5.7% |
| Panamanians | 4.5 /100 | #218 | Tragic 5.8% |
| French Canadians | 4.4 /100 | #219 | Tragic 5.8% |
| Sierra Leoneans | 3.9 /100 | #220 | Tragic 5.8% |
| Guamanians/Chamorros | 3.9 /100 | #221 | Tragic 5.8% |
| Spaniards | 3.2 /100 | #222 | Tragic 5.8% |
| Bermudans | 2.7 /100 | #223 | Tragic 5.8% |
| Slovaks | 2.5 /100 | #224 | Tragic 5.8% |
| Samoans | 2.5 /100 | #225 | Tragic 5.8% |
| Liberians | 2.3 /100 | #226 | Tragic 5.8% |
| Spanish | 1.8 /100 | #227 | Tragic 5.8% |
| Immigrants | Bahamas | 1.8 /100 | #228 | Tragic 5.8% |
| Immigrants | Uzbekistan | 1.5 /100 | #229 | Tragic 5.9% |
Demographics Similar to Uruguayans by Unemployment Among Ages 30 to 34 years
In terms of unemployment among ages 30 to 34 years, the demographic groups most similar to Uruguayans are Scandinavian (5.2%, a difference of 0.070%), Indonesian (5.2%, a difference of 0.13%), Immigrants from Lithuania (5.2%, a difference of 0.17%), Iranian (5.2%, a difference of 0.28%), and Immigrants from Indonesia (5.2%, a difference of 0.28%).
| Demographics | Rating | Rank | Unemployment Among Ages 30 to 34 years |
| Immigrants | Iraq | 96.4 /100 | #70 | Exceptional 5.1% |
| Paraguayans | 96.4 /100 | #71 | Exceptional 5.1% |
| Immigrants | Moldova | 96.4 /100 | #72 | Exceptional 5.1% |
| Slovenes | 96.2 /100 | #73 | Exceptional 5.2% |
| Immigrants | Asia | 96.2 /100 | #74 | Exceptional 5.2% |
| Iranians | 96.0 /100 | #75 | Exceptional 5.2% |
| Scandinavians | 95.6 /100 | #76 | Exceptional 5.2% |
| Uruguayans | 95.4 /100 | #77 | Exceptional 5.2% |
| Indonesians | 95.1 /100 | #78 | Exceptional 5.2% |
| Immigrants | Lithuania | 95.0 /100 | #79 | Exceptional 5.2% |
| Immigrants | Indonesia | 94.7 /100 | #80 | Exceptional 5.2% |
| Chileans | 94.4 /100 | #81 | Exceptional 5.2% |
| Immigrants | Latvia | 94.2 /100 | #82 | Exceptional 5.2% |
| Immigrants | Korea | 94.1 /100 | #83 | Exceptional 5.2% |
| Immigrants | Uganda | 94.0 /100 | #84 | Exceptional 5.2% |