Spaniard vs Immigrants from Ethiopia Male Poverty
COMPARE
Spaniard
Immigrants from Ethiopia
Male Poverty
Male Poverty Comparison
Spaniards
Immigrants from Ethiopia
11.7%
MALE POVERTY
13.5/ 100
METRIC RATING
201st/ 347
METRIC RANK
11.2%
MALE POVERTY
50.7/ 100
METRIC RATING
172nd/ 347
METRIC RANK
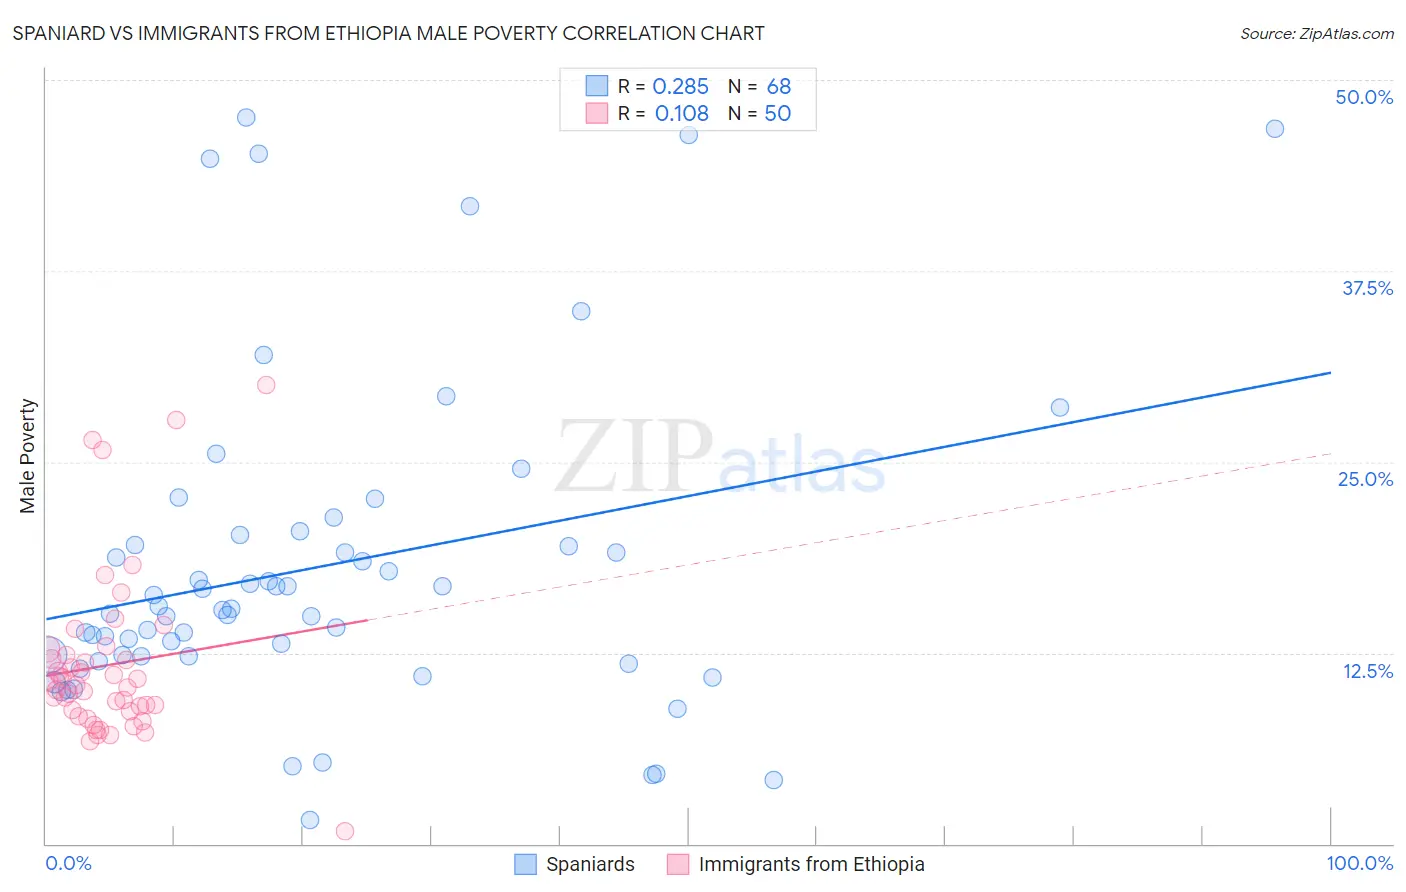
Spaniard vs Immigrants from Ethiopia Male Poverty Correlation Chart
The statistical analysis conducted on geographies consisting of 442,977,200 people shows a weak positive correlation between the proportion of Spaniards and poverty level among males in the United States with a correlation coefficient (R) of 0.285 and weighted average of 11.7%. Similarly, the statistical analysis conducted on geographies consisting of 211,452,093 people shows a poor positive correlation between the proportion of Immigrants from Ethiopia and poverty level among males in the United States with a correlation coefficient (R) of 0.108 and weighted average of 11.2%, a difference of 4.6%.
Male Poverty Correlation Summary
| Measurement | Spaniard | Immigrants from Ethiopia |
| Minimum | 1.5% | 0.81% |
| Maximum | 47.5% | 30.0% |
| Range | 46.0% | 29.2% |
| Mean | 18.1% | 11.7% |
| Median | 15.3% | 10.3% |
| Interquartile 25% (IQ1) | 12.3% | 8.7% |
| Interquartile 75% (IQ3) | 19.9% | 12.4% |
| Interquartile Range (IQR) | 7.6% | 3.7% |
| Standard Deviation (Sample) | 10.6% | 5.6% |
| Standard Deviation (Population) | 10.5% | 5.5% |
Similar Demographics by Male Poverty
Demographics Similar to Spaniards by Male Poverty
In terms of male poverty, the demographic groups most similar to Spaniards are Immigrants from Lebanon (11.7%, a difference of 0.010%), Spanish (11.7%, a difference of 0.11%), Iraqi (11.7%, a difference of 0.22%), Delaware (11.7%, a difference of 0.36%), and Arab (11.6%, a difference of 0.42%).
| Demographics | Rating | Rank | Male Poverty |
| Immigrants | Kenya | 16.1 /100 | #194 | Poor 11.6% |
| Arabs | 15.8 /100 | #195 | Poor 11.6% |
| Hmong | 15.8 /100 | #196 | Poor 11.6% |
| Delaware | 15.4 /100 | #197 | Poor 11.7% |
| Iraqis | 14.7 /100 | #198 | Poor 11.7% |
| Spanish | 14.1 /100 | #199 | Poor 11.7% |
| Immigrants | Lebanon | 13.6 /100 | #200 | Poor 11.7% |
| Spaniards | 13.5 /100 | #201 | Poor 11.7% |
| Aleuts | 10.4 /100 | #202 | Poor 11.8% |
| Immigrants | Western Asia | 9.8 /100 | #203 | Tragic 11.8% |
| Immigrants | Uganda | 8.5 /100 | #204 | Tragic 11.8% |
| Panamanians | 6.2 /100 | #205 | Tragic 11.9% |
| Immigrants | Eastern Africa | 5.4 /100 | #206 | Tragic 12.0% |
| Malaysians | 5.2 /100 | #207 | Tragic 12.0% |
| Immigrants | Immigrants | 4.5 /100 | #208 | Tragic 12.0% |
Demographics Similar to Immigrants from Ethiopia by Male Poverty
In terms of male poverty, the demographic groups most similar to Immigrants from Ethiopia are Pennsylvania German (11.2%, a difference of 0.020%), Uruguayan (11.2%, a difference of 0.040%), Immigrants from Oceania (11.2%, a difference of 0.070%), South American (11.1%, a difference of 0.30%), and Celtic (11.2%, a difference of 0.32%).
| Demographics | Rating | Rank | Male Poverty |
| Immigrants | Spain | 55.5 /100 | #165 | Average 11.1% |
| Immigrants | Albania | 55.3 /100 | #166 | Average 11.1% |
| Hungarians | 55.1 /100 | #167 | Average 11.1% |
| Immigrants | Portugal | 54.9 /100 | #168 | Average 11.1% |
| Immigrants | Colombia | 54.2 /100 | #169 | Average 11.1% |
| South Americans | 53.8 /100 | #170 | Average 11.1% |
| Uruguayans | 51.0 /100 | #171 | Average 11.2% |
| Immigrants | Ethiopia | 50.7 /100 | #172 | Average 11.2% |
| Pennsylvania Germans | 50.5 /100 | #173 | Average 11.2% |
| Immigrants | Oceania | 50.0 /100 | #174 | Average 11.2% |
| Celtics | 47.5 /100 | #175 | Average 11.2% |
| Immigrants | Fiji | 46.0 /100 | #176 | Average 11.2% |
| Lebanese | 45.6 /100 | #177 | Average 11.2% |
| Immigrants | Cameroon | 44.5 /100 | #178 | Average 11.2% |
| Immigrants | Syria | 40.3 /100 | #179 | Average 11.3% |