Spaniard vs Immigrants from Ethiopia Family Households with Children
COMPARE
Spaniard
Immigrants from Ethiopia
Family Households with Children
Family Households with Children Comparison
Spaniards
Immigrants from Ethiopia
28.0%
FAMILY HOUSEHOLDS WITH CHILDREN
97.4/ 100
METRIC RATING
110th/ 347
METRIC RANK
27.8%
FAMILY HOUSEHOLDS WITH CHILDREN
90.5/ 100
METRIC RATING
126th/ 347
METRIC RANK
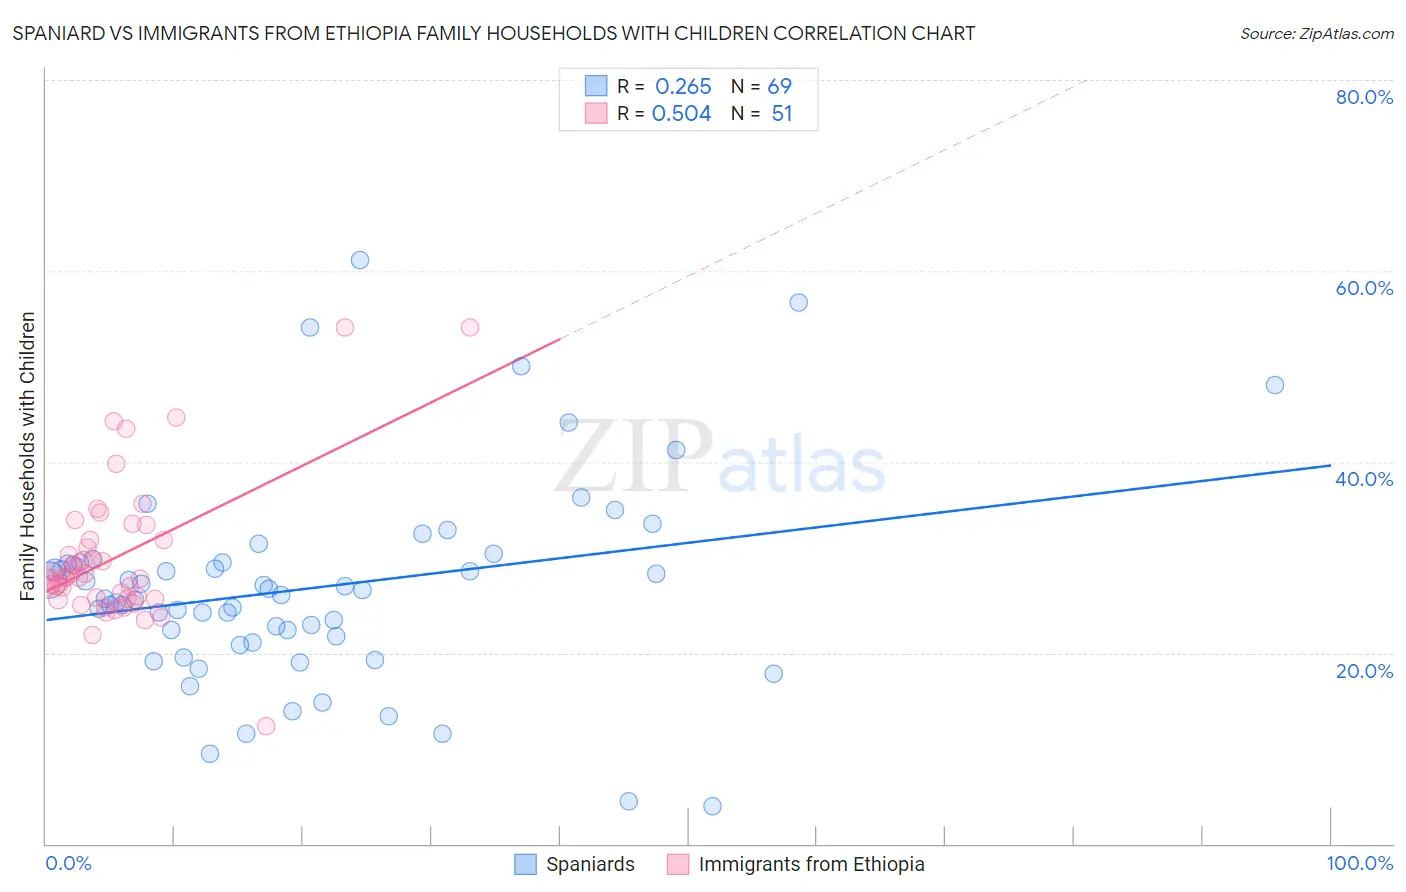
Spaniard vs Immigrants from Ethiopia Family Households with Children Correlation Chart
The statistical analysis conducted on geographies consisting of 442,990,827 people shows a weak positive correlation between the proportion of Spaniards and percentage of family households with children in the United States with a correlation coefficient (R) of 0.265 and weighted average of 28.0%. Similarly, the statistical analysis conducted on geographies consisting of 211,422,871 people shows a substantial positive correlation between the proportion of Immigrants from Ethiopia and percentage of family households with children in the United States with a correlation coefficient (R) of 0.504 and weighted average of 27.8%, a difference of 0.75%.
Family Households with Children Correlation Summary
| Measurement | Spaniard | Immigrants from Ethiopia |
| Minimum | 3.9% | 12.2% |
| Maximum | 61.2% | 54.1% |
| Range | 57.3% | 41.9% |
| Mean | 26.8% | 30.0% |
| Median | 26.1% | 27.9% |
| Interquartile 25% (IQ1) | 21.4% | 25.7% |
| Interquartile 75% (IQ3) | 29.5% | 31.9% |
| Interquartile Range (IQR) | 8.0% | 6.2% |
| Standard Deviation (Sample) | 10.7% | 7.5% |
| Standard Deviation (Population) | 10.6% | 7.4% |
Demographics Similar to Spaniards and Immigrants from Ethiopia by Family Households with Children
In terms of family households with children, the demographic groups most similar to Spaniards are Tohono O'odham (28.0%, a difference of 0.040%), Immigrants from Burma/Myanmar (28.0%, a difference of 0.050%), Scandinavian (28.0%, a difference of 0.060%), Immigrants from Middle Africa (28.0%, a difference of 0.090%), and Arab (28.0%, a difference of 0.10%). Similarly, the demographic groups most similar to Immigrants from Ethiopia are Immigrants from Singapore (27.8%, a difference of 0.020%), Ecuadorian (27.8%, a difference of 0.020%), Belizean (27.8%, a difference of 0.030%), Syrian (27.8%, a difference of 0.050%), and Immigrants from Northern Africa (27.8%, a difference of 0.090%).
| Demographics | Rating | Rank | Family Households with Children |
| Immigrants | Burma/Myanmar | 97.7 /100 | #108 | Exceptional 28.0% |
| Tohono O'odham | 97.6 /100 | #109 | Exceptional 28.0% |
| Spaniards | 97.4 /100 | #110 | Exceptional 28.0% |
| Scandinavians | 97.1 /100 | #111 | Exceptional 28.0% |
| Immigrants | Middle Africa | 97.0 /100 | #112 | Exceptional 28.0% |
| Arabs | 97.0 /100 | #113 | Exceptional 28.0% |
| South American Indians | 96.9 /100 | #114 | Exceptional 28.0% |
| Immigrants | Africa | 96.8 /100 | #115 | Exceptional 28.0% |
| Pakistanis | 96.0 /100 | #116 | Exceptional 27.9% |
| Immigrants | Malaysia | 95.9 /100 | #117 | Exceptional 27.9% |
| Central American Indians | 95.9 /100 | #118 | Exceptional 27.9% |
| Zimbabweans | 95.6 /100 | #119 | Exceptional 27.9% |
| Europeans | 95.4 /100 | #120 | Exceptional 27.9% |
| Immigrants | Western Asia | 93.6 /100 | #121 | Exceptional 27.9% |
| Immigrants | Zimbabwe | 92.8 /100 | #122 | Exceptional 27.8% |
| Immigrants | Northern Africa | 91.8 /100 | #123 | Exceptional 27.8% |
| Immigrants | Singapore | 90.8 /100 | #124 | Exceptional 27.8% |
| Ecuadorians | 90.8 /100 | #125 | Exceptional 27.8% |
| Immigrants | Ethiopia | 90.5 /100 | #126 | Exceptional 27.8% |
| Belizeans | 90.0 /100 | #127 | Exceptional 27.8% |
| Syrians | 89.7 /100 | #128 | Excellent 27.8% |