South American vs Spanish Family Households
COMPARE
South American
Spanish
Family Households
Family Households Comparison
South Americans
Spanish
66.0%
FAMILY HOUSEHOLDS
100.0/ 100
METRIC RATING
60th/ 347
METRIC RANK
65.0%
FAMILY HOUSEHOLDS
96.2/ 100
METRIC RATING
113th/ 347
METRIC RANK
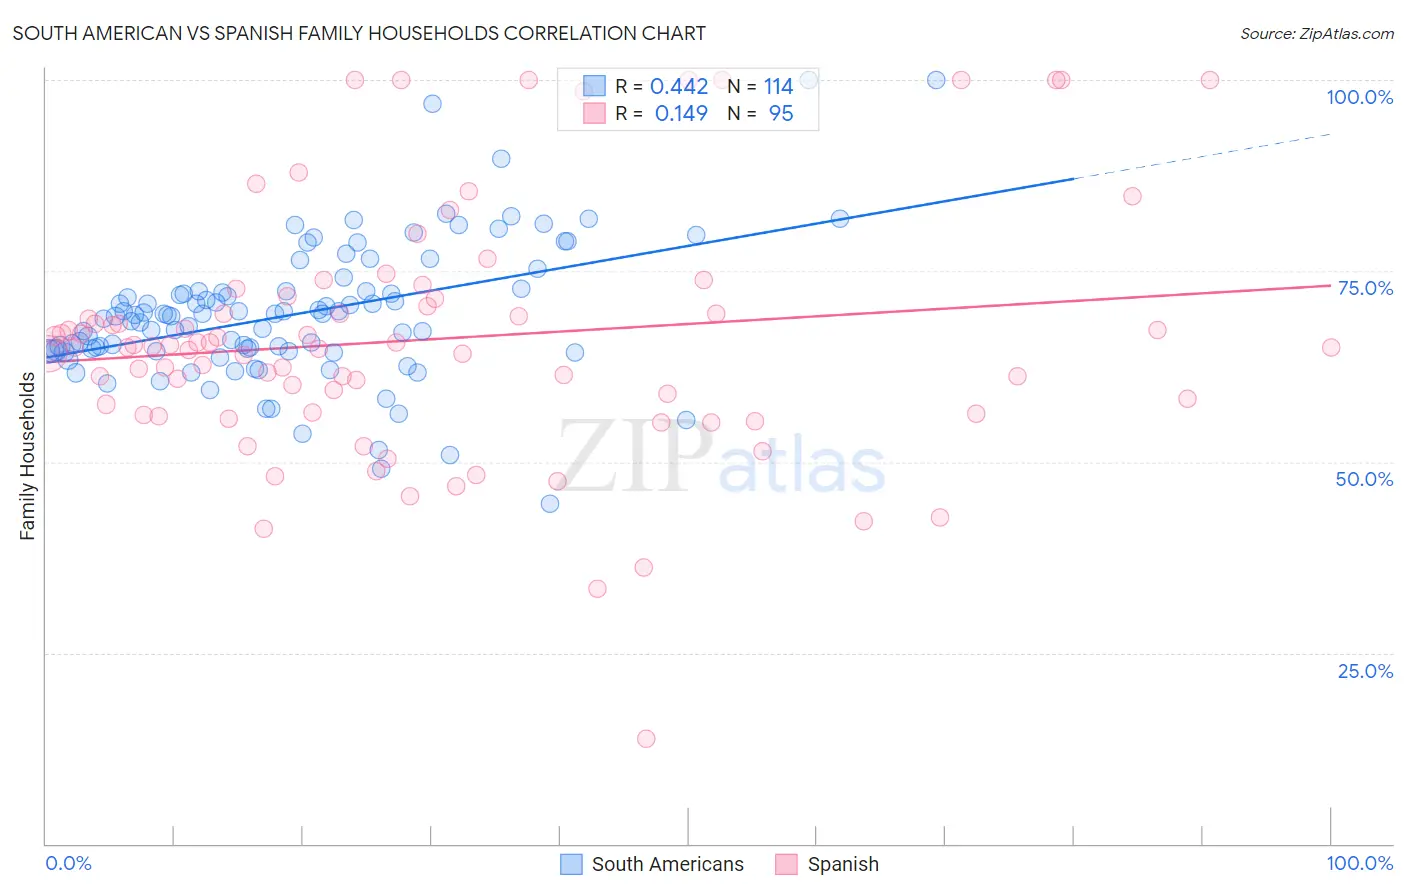
South American vs Spanish Family Households Correlation Chart
The statistical analysis conducted on geographies consisting of 493,649,007 people shows a moderate positive correlation between the proportion of South Americans and percentage of family households in the United States with a correlation coefficient (R) of 0.442 and weighted average of 66.0%. Similarly, the statistical analysis conducted on geographies consisting of 421,920,076 people shows a poor positive correlation between the proportion of Spanish and percentage of family households in the United States with a correlation coefficient (R) of 0.149 and weighted average of 65.0%, a difference of 1.6%.
Family Households Correlation Summary
| Measurement | South American | Spanish |
| Minimum | 44.4% | 13.8% |
| Maximum | 100.0% | 100.0% |
| Range | 55.6% | 86.3% |
| Mean | 69.3% | 66.1% |
| Median | 69.1% | 65.0% |
| Interquartile 25% (IQ1) | 64.5% | 56.5% |
| Interquartile 75% (IQ3) | 72.3% | 71.4% |
| Interquartile Range (IQR) | 7.8% | 15.0% |
| Standard Deviation (Sample) | 9.1% | 16.2% |
| Standard Deviation (Population) | 9.1% | 16.2% |
Similar Demographics by Family Households
Demographics Similar to South Americans by Family Households
In terms of family households, the demographic groups most similar to South Americans are Immigrants from Korea (66.0%, a difference of 0.010%), Danish (66.0%, a difference of 0.020%), Immigrants from Asia (66.1%, a difference of 0.030%), Central American (66.0%, a difference of 0.050%), and Immigrants from Indonesia (66.0%, a difference of 0.090%).
| Demographics | Rating | Rank | Family Households |
| Afghans | 100.0 /100 | #53 | Exceptional 66.3% |
| Immigrants | Colombia | 100.0 /100 | #54 | Exceptional 66.3% |
| Immigrants | Immigrants | 100.0 /100 | #55 | Exceptional 66.1% |
| Immigrants | Hong Kong | 100.0 /100 | #56 | Exceptional 66.1% |
| Pennsylvania Germans | 100.0 /100 | #57 | Exceptional 66.1% |
| Immigrants | Asia | 100.0 /100 | #58 | Exceptional 66.1% |
| Immigrants | Korea | 100.0 /100 | #59 | Exceptional 66.0% |
| South Americans | 100.0 /100 | #60 | Exceptional 66.0% |
| Danes | 100.0 /100 | #61 | Exceptional 66.0% |
| Central Americans | 100.0 /100 | #62 | Exceptional 66.0% |
| Immigrants | Indonesia | 100.0 /100 | #63 | Exceptional 66.0% |
| Pima | 99.9 /100 | #64 | Exceptional 65.9% |
| Costa Ricans | 99.9 /100 | #65 | Exceptional 65.9% |
| Fijians | 99.9 /100 | #66 | Exceptional 65.9% |
| Filipinos | 99.9 /100 | #67 | Exceptional 65.9% |
Demographics Similar to Spanish by Family Households
In terms of family households, the demographic groups most similar to Spanish are Immigrants from Jordan (65.0%, a difference of 0.030%), Argentinean (65.0%, a difference of 0.040%), Scandinavian (65.0%, a difference of 0.060%), European (65.0%, a difference of 0.060%), and Ecuadorian (65.0%, a difference of 0.060%).
| Demographics | Rating | Rank | Family Households |
| Whites/Caucasians | 97.3 /100 | #106 | Exceptional 65.1% |
| Alaska Natives | 97.3 /100 | #107 | Exceptional 65.1% |
| Palestinians | 97.2 /100 | #108 | Exceptional 65.1% |
| Immigrants | Guatemala | 96.9 /100 | #109 | Exceptional 65.0% |
| Scandinavians | 96.8 /100 | #110 | Exceptional 65.0% |
| Europeans | 96.8 /100 | #111 | Exceptional 65.0% |
| Immigrants | Jordan | 96.5 /100 | #112 | Exceptional 65.0% |
| Spanish | 96.2 /100 | #113 | Exceptional 65.0% |
| Argentineans | 95.7 /100 | #114 | Exceptional 65.0% |
| Ecuadorians | 95.4 /100 | #115 | Exceptional 65.0% |
| Immigrants | Iraq | 95.4 /100 | #116 | Exceptional 65.0% |
| Cherokee | 95.3 /100 | #117 | Exceptional 65.0% |
| Dutch | 95.1 /100 | #118 | Exceptional 64.9% |
| Immigrants | Eastern Asia | 94.4 /100 | #119 | Exceptional 64.9% |
| Immigrants | Oceania | 94.2 /100 | #120 | Exceptional 64.9% |