Somali vs Japanese Median Earnings
COMPARE
Somali
Japanese
Median Earnings
Median Earnings Comparison
Somalis
Japanese
$43,567
MEDIAN EARNINGS
1.8/ 100
METRIC RATING
253rd/ 347
METRIC RANK
$44,825
MEDIAN EARNINGS
9.5/ 100
METRIC RATING
231st/ 347
METRIC RANK
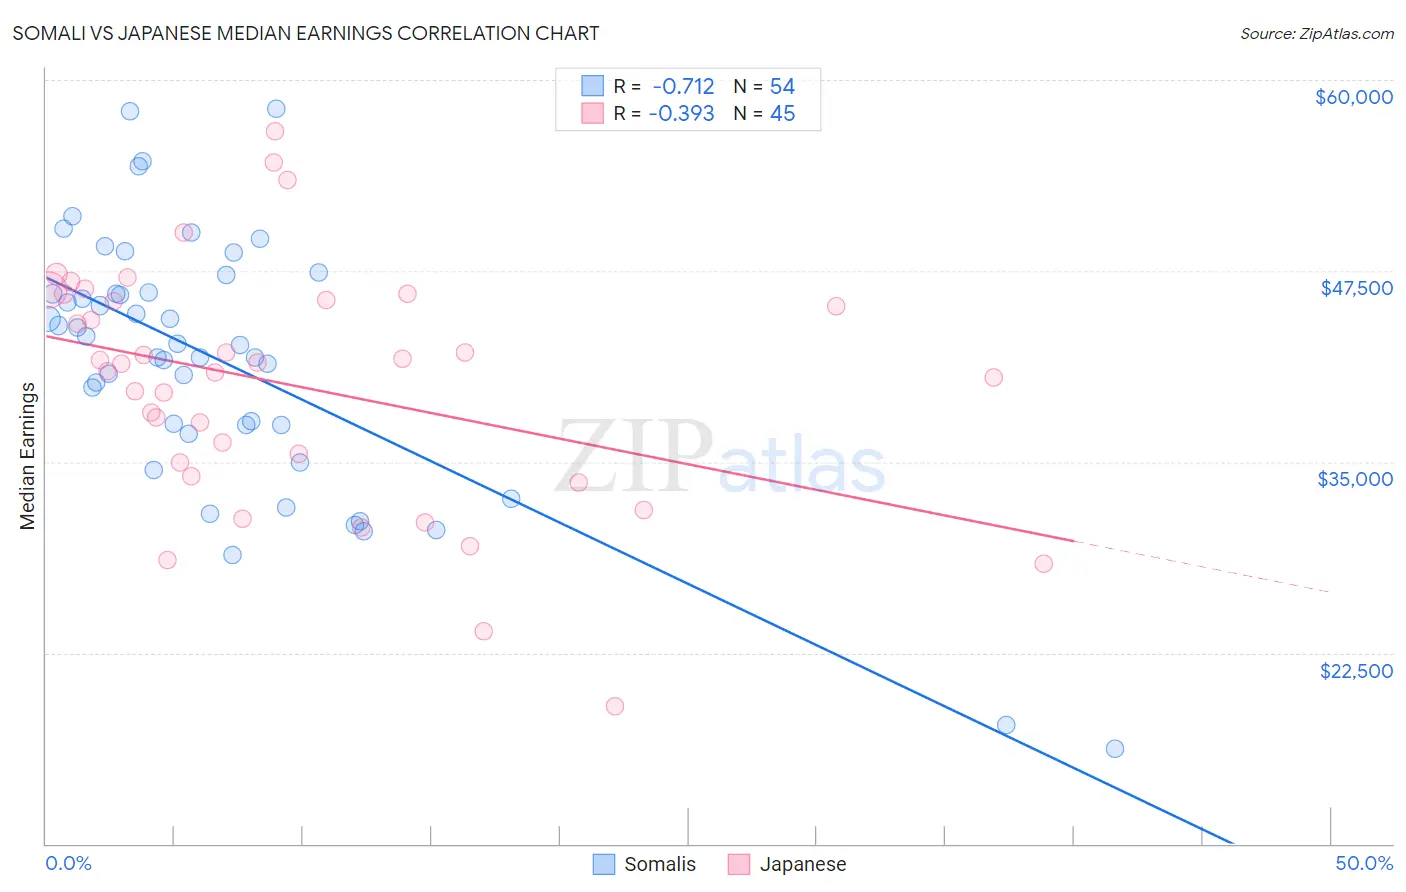
Somali vs Japanese Median Earnings Correlation Chart
The statistical analysis conducted on geographies consisting of 99,321,613 people shows a strong negative correlation between the proportion of Somalis and median earnings in the United States with a correlation coefficient (R) of -0.712 and weighted average of $43,567. Similarly, the statistical analysis conducted on geographies consisting of 249,187,165 people shows a mild negative correlation between the proportion of Japanese and median earnings in the United States with a correlation coefficient (R) of -0.393 and weighted average of $44,825, a difference of 2.9%.
Median Earnings Correlation Summary
| Measurement | Somali | Japanese |
| Minimum | $16,214 | $19,004 |
| Maximum | $58,125 | $56,680 |
| Range | $41,911 | $37,676 |
| Mean | $41,593 | $40,035 |
| Median | $42,677 | $41,417 |
| Interquartile 25% (IQ1) | $37,388 | $34,525 |
| Interquartile 75% (IQ3) | $46,056 | $45,796 |
| Interquartile Range (IQR) | $8,668 | $11,271 |
| Standard Deviation (Sample) | $8,542 | $7,916 |
| Standard Deviation (Population) | $8,463 | $7,827 |
Similar Demographics by Median Earnings
Demographics Similar to Somalis by Median Earnings
In terms of median earnings, the demographic groups most similar to Somalis are Liberian ($43,536, a difference of 0.070%), Hawaiian ($43,673, a difference of 0.24%), Tsimshian ($43,695, a difference of 0.30%), Immigrants from Middle Africa ($43,416, a difference of 0.35%), and Alaskan Athabascan ($43,393, a difference of 0.40%).
| Demographics | Rating | Rank | Median Earnings |
| Immigrants | West Indies | 3.1 /100 | #246 | Tragic $43,989 |
| Immigrants | Cabo Verde | 3.0 /100 | #247 | Tragic $43,963 |
| Nepalese | 2.6 /100 | #248 | Tragic $43,860 |
| Malaysians | 2.6 /100 | #249 | Tragic $43,844 |
| Alaska Natives | 2.3 /100 | #250 | Tragic $43,750 |
| Tsimshian | 2.1 /100 | #251 | Tragic $43,695 |
| Hawaiians | 2.0 /100 | #252 | Tragic $43,673 |
| Somalis | 1.8 /100 | #253 | Tragic $43,567 |
| Liberians | 1.7 /100 | #254 | Tragic $43,536 |
| Immigrants | Middle Africa | 1.4 /100 | #255 | Tragic $43,416 |
| Alaskan Athabascans | 1.4 /100 | #256 | Tragic $43,393 |
| Jamaicans | 1.3 /100 | #257 | Tragic $43,343 |
| French American Indians | 1.3 /100 | #258 | Tragic $43,333 |
| German Russians | 1.1 /100 | #259 | Tragic $43,200 |
| Immigrants | Somalia | 0.9 /100 | #260 | Tragic $43,100 |
Demographics Similar to Japanese by Median Earnings
In terms of median earnings, the demographic groups most similar to Japanese are Delaware ($44,783, a difference of 0.090%), Immigrants from Sudan ($44,767, a difference of 0.13%), Immigrants from Western Africa ($44,893, a difference of 0.15%), Scotch-Irish ($44,924, a difference of 0.22%), and Immigrants from Iraq ($44,988, a difference of 0.37%).
| Demographics | Rating | Rank | Median Earnings |
| West Indians | 13.9 /100 | #224 | Poor $45,132 |
| Immigrants | Cambodia | 13.2 /100 | #225 | Poor $45,090 |
| Immigrants | Nigeria | 12.2 /100 | #226 | Poor $45,030 |
| Native Hawaiians | 12.2 /100 | #227 | Poor $45,027 |
| Immigrants | Iraq | 11.6 /100 | #228 | Poor $44,988 |
| Scotch-Irish | 10.7 /100 | #229 | Poor $44,924 |
| Immigrants | Western Africa | 10.3 /100 | #230 | Poor $44,893 |
| Japanese | 9.5 /100 | #231 | Tragic $44,825 |
| Delaware | 9.0 /100 | #232 | Tragic $44,783 |
| Immigrants | Sudan | 8.8 /100 | #233 | Tragic $44,767 |
| Cape Verdeans | 7.5 /100 | #234 | Tragic $44,640 |
| Venezuelans | 6.9 /100 | #235 | Tragic $44,580 |
| British West Indians | 6.7 /100 | #236 | Tragic $44,552 |
| Immigrants | Ecuador | 5.9 /100 | #237 | Tragic $44,462 |
| Sudanese | 5.6 /100 | #238 | Tragic $44,419 |