Somali vs Chilean Median Earnings
COMPARE
Somali
Chilean
Median Earnings
Median Earnings Comparison
Somalis
Chileans
$43,567
MEDIAN EARNINGS
1.8/ 100
METRIC RATING
253rd/ 347
METRIC RANK
$48,504
MEDIAN EARNINGS
94.8/ 100
METRIC RATING
122nd/ 347
METRIC RANK
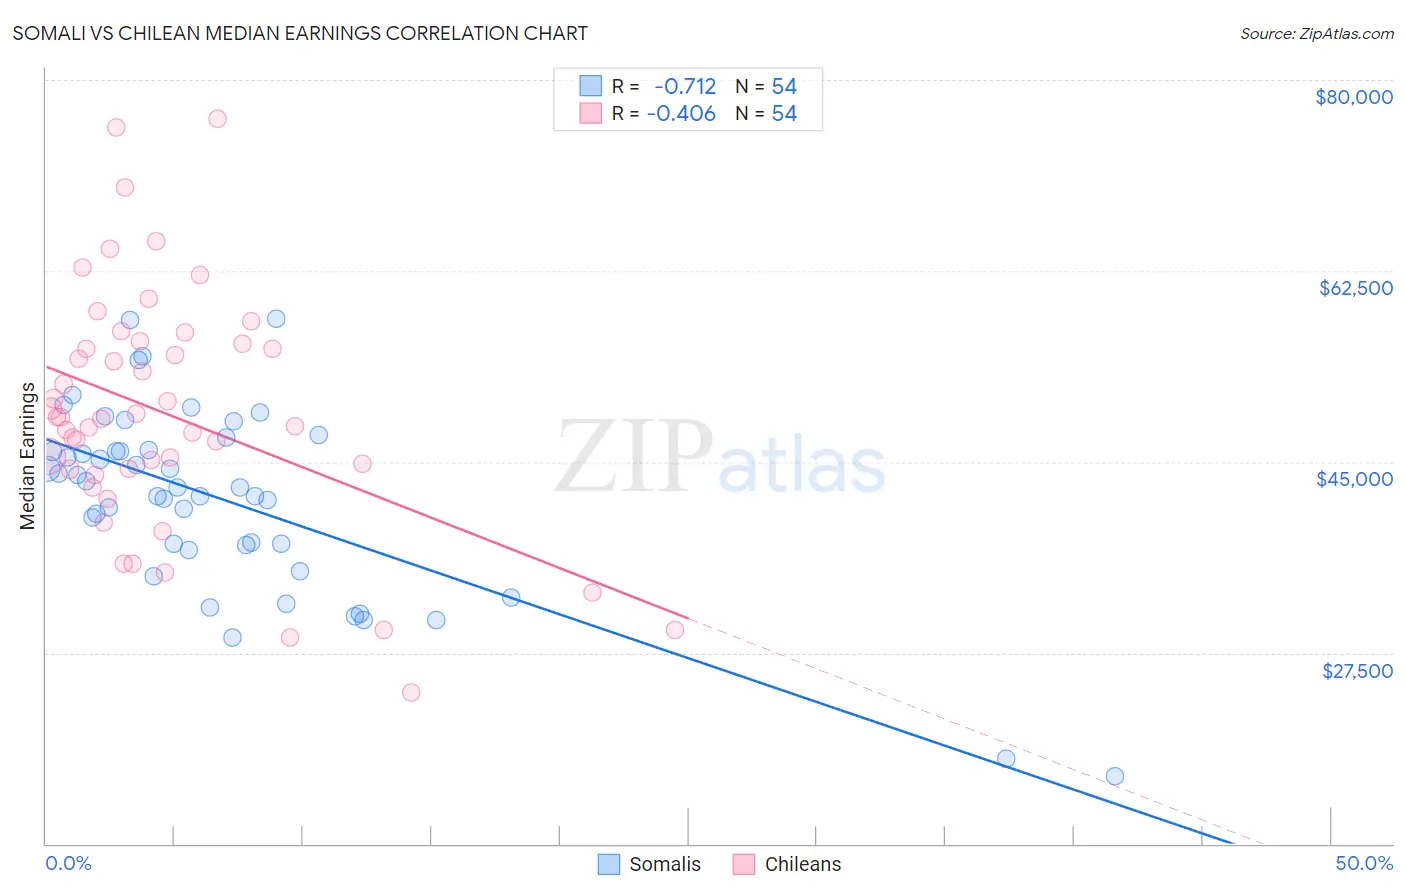
Somali vs Chilean Median Earnings Correlation Chart
The statistical analysis conducted on geographies consisting of 99,321,613 people shows a strong negative correlation between the proportion of Somalis and median earnings in the United States with a correlation coefficient (R) of -0.712 and weighted average of $43,567. Similarly, the statistical analysis conducted on geographies consisting of 256,682,531 people shows a moderate negative correlation between the proportion of Chileans and median earnings in the United States with a correlation coefficient (R) of -0.406 and weighted average of $48,504, a difference of 11.3%.
Median Earnings Correlation Summary
| Measurement | Somali | Chilean |
| Minimum | $16,214 | $23,911 |
| Maximum | $58,125 | $76,406 |
| Range | $41,911 | $52,495 |
| Mean | $41,593 | $49,382 |
| Median | $42,677 | $48,999 |
| Interquartile 25% (IQ1) | $37,388 | $44,321 |
| Interquartile 75% (IQ3) | $46,056 | $55,791 |
| Interquartile Range (IQR) | $8,668 | $11,470 |
| Standard Deviation (Sample) | $8,542 | $11,094 |
| Standard Deviation (Population) | $8,463 | $10,991 |
Similar Demographics by Median Earnings
Demographics Similar to Somalis by Median Earnings
In terms of median earnings, the demographic groups most similar to Somalis are Liberian ($43,536, a difference of 0.070%), Hawaiian ($43,673, a difference of 0.24%), Tsimshian ($43,695, a difference of 0.30%), Immigrants from Middle Africa ($43,416, a difference of 0.35%), and Alaskan Athabascan ($43,393, a difference of 0.40%).
| Demographics | Rating | Rank | Median Earnings |
| Immigrants | West Indies | 3.1 /100 | #246 | Tragic $43,989 |
| Immigrants | Cabo Verde | 3.0 /100 | #247 | Tragic $43,963 |
| Nepalese | 2.6 /100 | #248 | Tragic $43,860 |
| Malaysians | 2.6 /100 | #249 | Tragic $43,844 |
| Alaska Natives | 2.3 /100 | #250 | Tragic $43,750 |
| Tsimshian | 2.1 /100 | #251 | Tragic $43,695 |
| Hawaiians | 2.0 /100 | #252 | Tragic $43,673 |
| Somalis | 1.8 /100 | #253 | Tragic $43,567 |
| Liberians | 1.7 /100 | #254 | Tragic $43,536 |
| Immigrants | Middle Africa | 1.4 /100 | #255 | Tragic $43,416 |
| Alaskan Athabascans | 1.4 /100 | #256 | Tragic $43,393 |
| Jamaicans | 1.3 /100 | #257 | Tragic $43,343 |
| French American Indians | 1.3 /100 | #258 | Tragic $43,333 |
| German Russians | 1.1 /100 | #259 | Tragic $43,200 |
| Immigrants | Somalia | 0.9 /100 | #260 | Tragic $43,100 |
Demographics Similar to Chileans by Median Earnings
In terms of median earnings, the demographic groups most similar to Chileans are Arab ($48,599, a difference of 0.19%), Carpatho Rusyn ($48,617, a difference of 0.23%), Immigrants from Syria ($48,375, a difference of 0.27%), Brazilian ($48,356, a difference of 0.31%), and Polish ($48,659, a difference of 0.32%).
| Demographics | Rating | Rank | Median Earnings |
| Chinese | 96.7 /100 | #115 | Exceptional $48,836 |
| Koreans | 96.2 /100 | #116 | Exceptional $48,727 |
| Serbians | 95.9 /100 | #117 | Exceptional $48,677 |
| Immigrants | Jordan | 95.9 /100 | #118 | Exceptional $48,673 |
| Poles | 95.8 /100 | #119 | Exceptional $48,659 |
| Carpatho Rusyns | 95.5 /100 | #120 | Exceptional $48,617 |
| Arabs | 95.4 /100 | #121 | Exceptional $48,599 |
| Chileans | 94.8 /100 | #122 | Exceptional $48,504 |
| Immigrants | Syria | 93.9 /100 | #123 | Exceptional $48,375 |
| Brazilians | 93.7 /100 | #124 | Exceptional $48,356 |
| Immigrants | Fiji | 93.3 /100 | #125 | Exceptional $48,305 |
| Assyrians/Chaldeans/Syriacs | 93.3 /100 | #126 | Exceptional $48,304 |
| Sierra Leoneans | 93.1 /100 | #127 | Exceptional $48,286 |
| Immigrants | Philippines | 92.9 /100 | #128 | Exceptional $48,266 |
| Pakistanis | 92.8 /100 | #129 | Exceptional $48,254 |