Somali vs Apache Unemployment Among Seniors over 75 years
COMPARE
Somali
Apache
Unemployment Among Seniors over 75 years
Unemployment Among Seniors over 75 years Comparison
Somalis
Apache
8.8%
UNEMPLOYMENT AMONG SENIORS OVER 75 YEARS
45.3/ 100
METRIC RATING
176th/ 347
METRIC RANK
8.4%
UNEMPLOYMENT AMONG SENIORS OVER 75 YEARS
95.2/ 100
METRIC RATING
130th/ 347
METRIC RANK
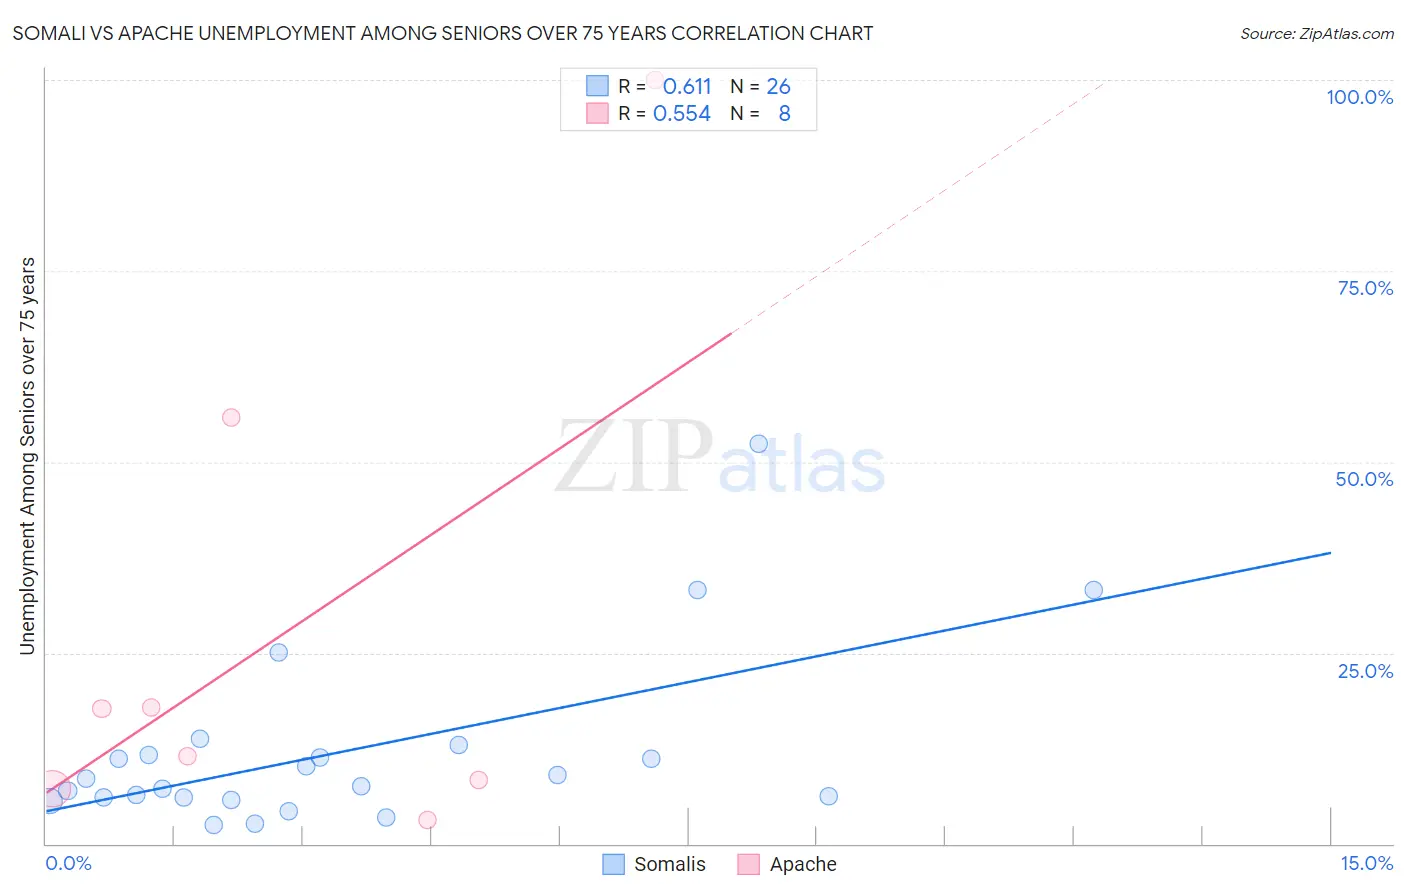
Somali vs Apache Unemployment Among Seniors over 75 years Correlation Chart
The statistical analysis conducted on geographies consisting of 71,654,664 people shows a significant positive correlation between the proportion of Somalis and unemployment rate among seniors over the age of 75 in the United States with a correlation coefficient (R) of 0.611 and weighted average of 8.8%. Similarly, the statistical analysis conducted on geographies consisting of 138,222,080 people shows a substantial positive correlation between the proportion of Apache and unemployment rate among seniors over the age of 75 in the United States with a correlation coefficient (R) of 0.554 and weighted average of 8.4%, a difference of 4.4%.
Unemployment Among Seniors over 75 years Correlation Summary
| Measurement | Somali | Apache |
| Minimum | 2.5% | 3.1% |
| Maximum | 52.4% | 100.0% |
| Range | 49.9% | 96.9% |
| Mean | 12.1% | 27.7% |
| Median | 8.0% | 14.6% |
| Interquartile 25% (IQ1) | 6.0% | 7.8% |
| Interquartile 75% (IQ3) | 11.7% | 36.8% |
| Interquartile Range (IQR) | 5.6% | 29.0% |
| Standard Deviation (Sample) | 11.5% | 33.5% |
| Standard Deviation (Population) | 11.3% | 31.4% |
Similar Demographics by Unemployment Among Seniors over 75 years
Demographics Similar to Somalis by Unemployment Among Seniors over 75 years
In terms of unemployment among seniors over 75 years, the demographic groups most similar to Somalis are Central American (8.8%, a difference of 0.11%), West Indian (8.8%, a difference of 0.19%), Immigrants from Italy (8.8%, a difference of 0.20%), Immigrants from Somalia (8.8%, a difference of 0.20%), and Syrian (8.7%, a difference of 0.23%).
| Demographics | Rating | Rank | Unemployment Among Seniors over 75 years |
| Fijians | 56.4 /100 | #169 | Average 8.7% |
| Zimbabweans | 54.1 /100 | #170 | Average 8.7% |
| Dominicans | 51.9 /100 | #171 | Average 8.7% |
| Immigrants | Immigrants | 51.8 /100 | #172 | Average 8.7% |
| Australians | 50.3 /100 | #173 | Average 8.7% |
| Immigrants | El Salvador | 49.7 /100 | #174 | Average 8.7% |
| Syrians | 49.6 /100 | #175 | Average 8.7% |
| Somalis | 45.3 /100 | #176 | Average 8.8% |
| Central Americans | 43.3 /100 | #177 | Average 8.8% |
| West Indians | 41.9 /100 | #178 | Average 8.8% |
| Immigrants | Italy | 41.7 /100 | #179 | Average 8.8% |
| Immigrants | Somalia | 41.7 /100 | #180 | Average 8.8% |
| Immigrants | Thailand | 40.2 /100 | #181 | Average 8.8% |
| Guatemalans | 39.5 /100 | #182 | Fair 8.8% |
| Immigrants | Afghanistan | 38.2 /100 | #183 | Fair 8.8% |
Demographics Similar to Apache by Unemployment Among Seniors over 75 years
In terms of unemployment among seniors over 75 years, the demographic groups most similar to Apache are German Russian (8.4%, a difference of 0.080%), Ghanaian (8.4%, a difference of 0.28%), Native Hawaiian (8.4%, a difference of 0.31%), Honduran (8.4%, a difference of 0.36%), and Belizean (8.4%, a difference of 0.37%).
| Demographics | Rating | Rank | Unemployment Among Seniors over 75 years |
| Immigrants | Nepal | 96.9 /100 | #123 | Exceptional 8.3% |
| Thais | 96.8 /100 | #124 | Exceptional 8.3% |
| Immigrants | Moldova | 96.7 /100 | #125 | Exceptional 8.3% |
| Belizeans | 96.3 /100 | #126 | Exceptional 8.4% |
| Hondurans | 96.2 /100 | #127 | Exceptional 8.4% |
| Native Hawaiians | 96.1 /100 | #128 | Exceptional 8.4% |
| Ghanaians | 96.0 /100 | #129 | Exceptional 8.4% |
| Apache | 95.2 /100 | #130 | Exceptional 8.4% |
| German Russians | 94.9 /100 | #131 | Exceptional 8.4% |
| Chileans | 93.8 /100 | #132 | Exceptional 8.4% |
| Serbians | 93.7 /100 | #133 | Exceptional 8.4% |
| Immigrants | Czechoslovakia | 93.4 /100 | #134 | Exceptional 8.4% |
| Haitians | 91.4 /100 | #135 | Exceptional 8.5% |
| Immigrants | Trinidad and Tobago | 90.8 /100 | #136 | Exceptional 8.5% |
| Immigrants | Kuwait | 90.5 /100 | #137 | Exceptional 8.5% |