Somali vs Immigrants from Croatia Median Earnings
COMPARE
Somali
Immigrants from Croatia
Median Earnings
Median Earnings Comparison
Somalis
Immigrants from Croatia
$43,567
MEDIAN EARNINGS
1.8/ 100
METRIC RATING
253rd/ 347
METRIC RANK
$51,581
MEDIAN EARNINGS
99.9/ 100
METRIC RATING
59th/ 347
METRIC RANK
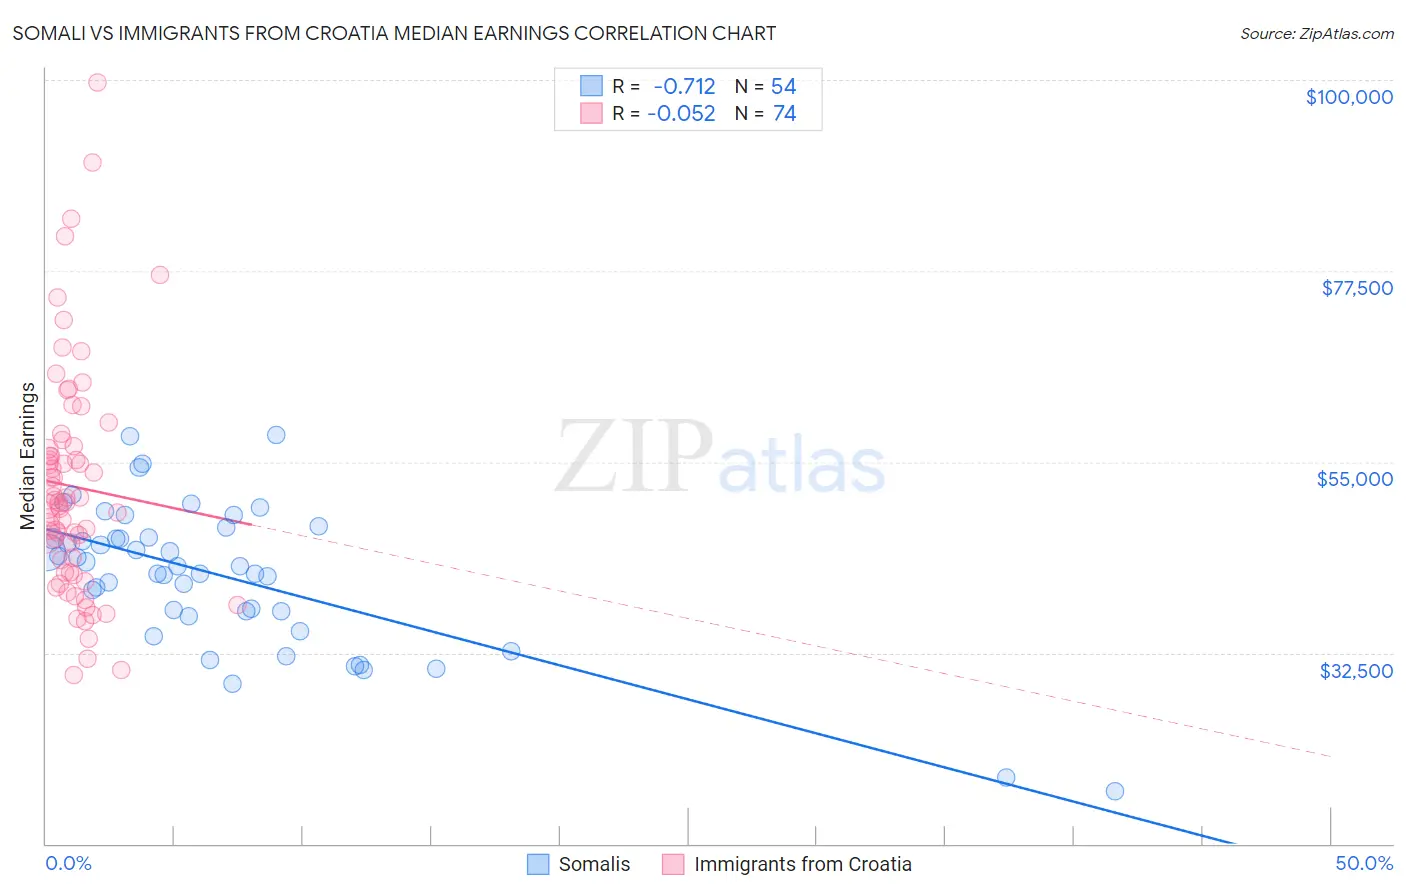
Somali vs Immigrants from Croatia Median Earnings Correlation Chart
The statistical analysis conducted on geographies consisting of 99,321,613 people shows a strong negative correlation between the proportion of Somalis and median earnings in the United States with a correlation coefficient (R) of -0.712 and weighted average of $43,567. Similarly, the statistical analysis conducted on geographies consisting of 132,573,888 people shows a slight negative correlation between the proportion of Immigrants from Croatia and median earnings in the United States with a correlation coefficient (R) of -0.052 and weighted average of $51,581, a difference of 18.4%.
Median Earnings Correlation Summary
| Measurement | Somali | Immigrants from Croatia |
| Minimum | $16,214 | $29,868 |
| Maximum | $58,125 | $99,706 |
| Range | $41,911 | $69,838 |
| Mean | $41,593 | $52,095 |
| Median | $42,677 | $50,253 |
| Interquartile 25% (IQ1) | $37,388 | $41,915 |
| Interquartile 75% (IQ3) | $46,056 | $56,902 |
| Interquartile Range (IQR) | $8,668 | $14,987 |
| Standard Deviation (Sample) | $8,542 | $13,541 |
| Standard Deviation (Population) | $8,463 | $13,449 |
Similar Demographics by Median Earnings
Demographics Similar to Somalis by Median Earnings
In terms of median earnings, the demographic groups most similar to Somalis are Liberian ($43,536, a difference of 0.070%), Hawaiian ($43,673, a difference of 0.24%), Tsimshian ($43,695, a difference of 0.30%), Immigrants from Middle Africa ($43,416, a difference of 0.35%), and Alaskan Athabascan ($43,393, a difference of 0.40%).
| Demographics | Rating | Rank | Median Earnings |
| Immigrants | West Indies | 3.1 /100 | #246 | Tragic $43,989 |
| Immigrants | Cabo Verde | 3.0 /100 | #247 | Tragic $43,963 |
| Nepalese | 2.6 /100 | #248 | Tragic $43,860 |
| Malaysians | 2.6 /100 | #249 | Tragic $43,844 |
| Alaska Natives | 2.3 /100 | #250 | Tragic $43,750 |
| Tsimshian | 2.1 /100 | #251 | Tragic $43,695 |
| Hawaiians | 2.0 /100 | #252 | Tragic $43,673 |
| Somalis | 1.8 /100 | #253 | Tragic $43,567 |
| Liberians | 1.7 /100 | #254 | Tragic $43,536 |
| Immigrants | Middle Africa | 1.4 /100 | #255 | Tragic $43,416 |
| Alaskan Athabascans | 1.4 /100 | #256 | Tragic $43,393 |
| Jamaicans | 1.3 /100 | #257 | Tragic $43,343 |
| French American Indians | 1.3 /100 | #258 | Tragic $43,333 |
| German Russians | 1.1 /100 | #259 | Tragic $43,200 |
| Immigrants | Somalia | 0.9 /100 | #260 | Tragic $43,100 |
Demographics Similar to Immigrants from Croatia by Median Earnings
In terms of median earnings, the demographic groups most similar to Immigrants from Croatia are Immigrants from Bolivia ($51,605, a difference of 0.050%), Immigrants from Serbia ($51,557, a difference of 0.050%), Immigrants from Latvia ($51,555, a difference of 0.050%), Immigrants from Eastern Europe ($51,624, a difference of 0.080%), and Immigrants from Pakistan ($51,693, a difference of 0.22%).
| Demographics | Rating | Rank | Median Earnings |
| Estonians | 99.9 /100 | #52 | Exceptional $51,772 |
| Immigrants | Norway | 99.9 /100 | #53 | Exceptional $51,758 |
| Immigrants | Indonesia | 99.9 /100 | #54 | Exceptional $51,715 |
| Egyptians | 99.9 /100 | #55 | Exceptional $51,701 |
| Immigrants | Pakistan | 99.9 /100 | #56 | Exceptional $51,693 |
| Immigrants | Eastern Europe | 99.9 /100 | #57 | Exceptional $51,624 |
| Immigrants | Bolivia | 99.9 /100 | #58 | Exceptional $51,605 |
| Immigrants | Croatia | 99.9 /100 | #59 | Exceptional $51,581 |
| Immigrants | Serbia | 99.9 /100 | #60 | Exceptional $51,557 |
| Immigrants | Latvia | 99.9 /100 | #61 | Exceptional $51,555 |
| Immigrants | Romania | 99.9 /100 | #62 | Exceptional $51,337 |
| Immigrants | Bulgaria | 99.9 /100 | #63 | Exceptional $51,318 |
| New Zealanders | 99.9 /100 | #64 | Exceptional $51,246 |
| Greeks | 99.9 /100 | #65 | Exceptional $51,164 |
| Afghans | 99.9 /100 | #66 | Exceptional $51,112 |