Somali vs Danish Median Earnings
COMPARE
Somali
Danish
Median Earnings
Median Earnings Comparison
Somalis
Danes
$43,567
MEDIAN EARNINGS
1.8/ 100
METRIC RATING
253rd/ 347
METRIC RANK
$46,392
MEDIAN EARNINGS
48.6/ 100
METRIC RATING
176th/ 347
METRIC RANK
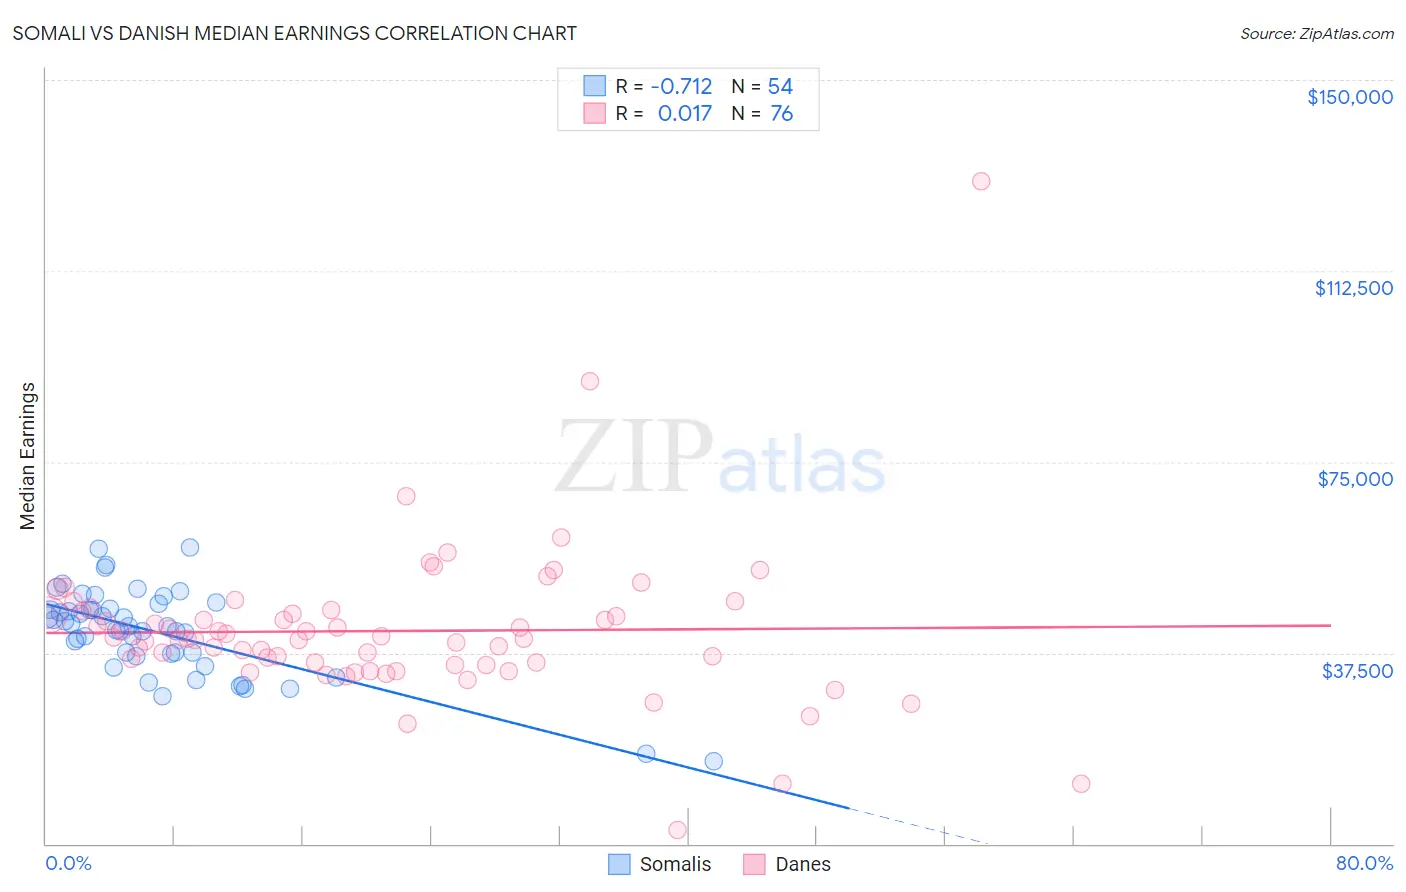
Somali vs Danish Median Earnings Correlation Chart
The statistical analysis conducted on geographies consisting of 99,321,613 people shows a strong negative correlation between the proportion of Somalis and median earnings in the United States with a correlation coefficient (R) of -0.712 and weighted average of $43,567. Similarly, the statistical analysis conducted on geographies consisting of 474,068,327 people shows no correlation between the proportion of Danes and median earnings in the United States with a correlation coefficient (R) of 0.017 and weighted average of $46,392, a difference of 6.5%.
Median Earnings Correlation Summary
| Measurement | Somali | Danish |
| Minimum | $16,214 | $2,766 |
| Maximum | $58,125 | $130,117 |
| Range | $41,911 | $127,351 |
| Mean | $41,593 | $41,795 |
| Median | $42,677 | $40,260 |
| Interquartile 25% (IQ1) | $37,388 | $35,372 |
| Interquartile 75% (IQ3) | $46,056 | $45,489 |
| Interquartile Range (IQR) | $8,668 | $10,117 |
| Standard Deviation (Sample) | $8,542 | $15,565 |
| Standard Deviation (Population) | $8,463 | $15,462 |
Similar Demographics by Median Earnings
Demographics Similar to Somalis by Median Earnings
In terms of median earnings, the demographic groups most similar to Somalis are Liberian ($43,536, a difference of 0.070%), Hawaiian ($43,673, a difference of 0.24%), Tsimshian ($43,695, a difference of 0.30%), Immigrants from Middle Africa ($43,416, a difference of 0.35%), and Alaskan Athabascan ($43,393, a difference of 0.40%).
| Demographics | Rating | Rank | Median Earnings |
| Immigrants | West Indies | 3.1 /100 | #246 | Tragic $43,989 |
| Immigrants | Cabo Verde | 3.0 /100 | #247 | Tragic $43,963 |
| Nepalese | 2.6 /100 | #248 | Tragic $43,860 |
| Malaysians | 2.6 /100 | #249 | Tragic $43,844 |
| Alaska Natives | 2.3 /100 | #250 | Tragic $43,750 |
| Tsimshian | 2.1 /100 | #251 | Tragic $43,695 |
| Hawaiians | 2.0 /100 | #252 | Tragic $43,673 |
| Somalis | 1.8 /100 | #253 | Tragic $43,567 |
| Liberians | 1.7 /100 | #254 | Tragic $43,536 |
| Immigrants | Middle Africa | 1.4 /100 | #255 | Tragic $43,416 |
| Alaskan Athabascans | 1.4 /100 | #256 | Tragic $43,393 |
| Jamaicans | 1.3 /100 | #257 | Tragic $43,343 |
| French American Indians | 1.3 /100 | #258 | Tragic $43,333 |
| German Russians | 1.1 /100 | #259 | Tragic $43,200 |
| Immigrants | Somalia | 0.9 /100 | #260 | Tragic $43,100 |
Demographics Similar to Danes by Median Earnings
In terms of median earnings, the demographic groups most similar to Danes are Basque ($46,399, a difference of 0.020%), Belgian ($46,375, a difference of 0.040%), Scandinavian ($46,433, a difference of 0.090%), Colombian ($46,349, a difference of 0.090%), and Ghanaian ($46,440, a difference of 0.10%).
| Demographics | Rating | Rank | Median Earnings |
| Immigrants | South America | 54.0 /100 | #169 | Average $46,548 |
| Immigrants | Immigrants | 51.6 /100 | #170 | Average $46,478 |
| Scottish | 51.1 /100 | #171 | Average $46,463 |
| Kenyans | 51.0 /100 | #172 | Average $46,462 |
| Ghanaians | 50.3 /100 | #173 | Average $46,440 |
| Scandinavians | 50.0 /100 | #174 | Average $46,433 |
| Basques | 48.8 /100 | #175 | Average $46,399 |
| Danes | 48.6 /100 | #176 | Average $46,392 |
| Belgians | 48.0 /100 | #177 | Average $46,375 |
| Colombians | 47.1 /100 | #178 | Average $46,349 |
| English | 46.5 /100 | #179 | Average $46,334 |
| Puget Sound Salish | 46.5 /100 | #180 | Average $46,333 |
| Immigrants | Cameroon | 46.4 /100 | #181 | Average $46,329 |
| Swiss | 45.9 /100 | #182 | Average $46,315 |
| French | 45.2 /100 | #183 | Average $46,296 |