Slavic vs Immigrants from Venezuela 1st Grade
COMPARE
Slavic
Immigrants from Venezuela
1st Grade
1st Grade Comparison
Slavs
Immigrants from Venezuela
98.4%
1ST GRADE
99.7/ 100
METRIC RATING
62nd/ 347
METRIC RANK
97.9%
1ST GRADE
47.8/ 100
METRIC RATING
178th/ 347
METRIC RANK
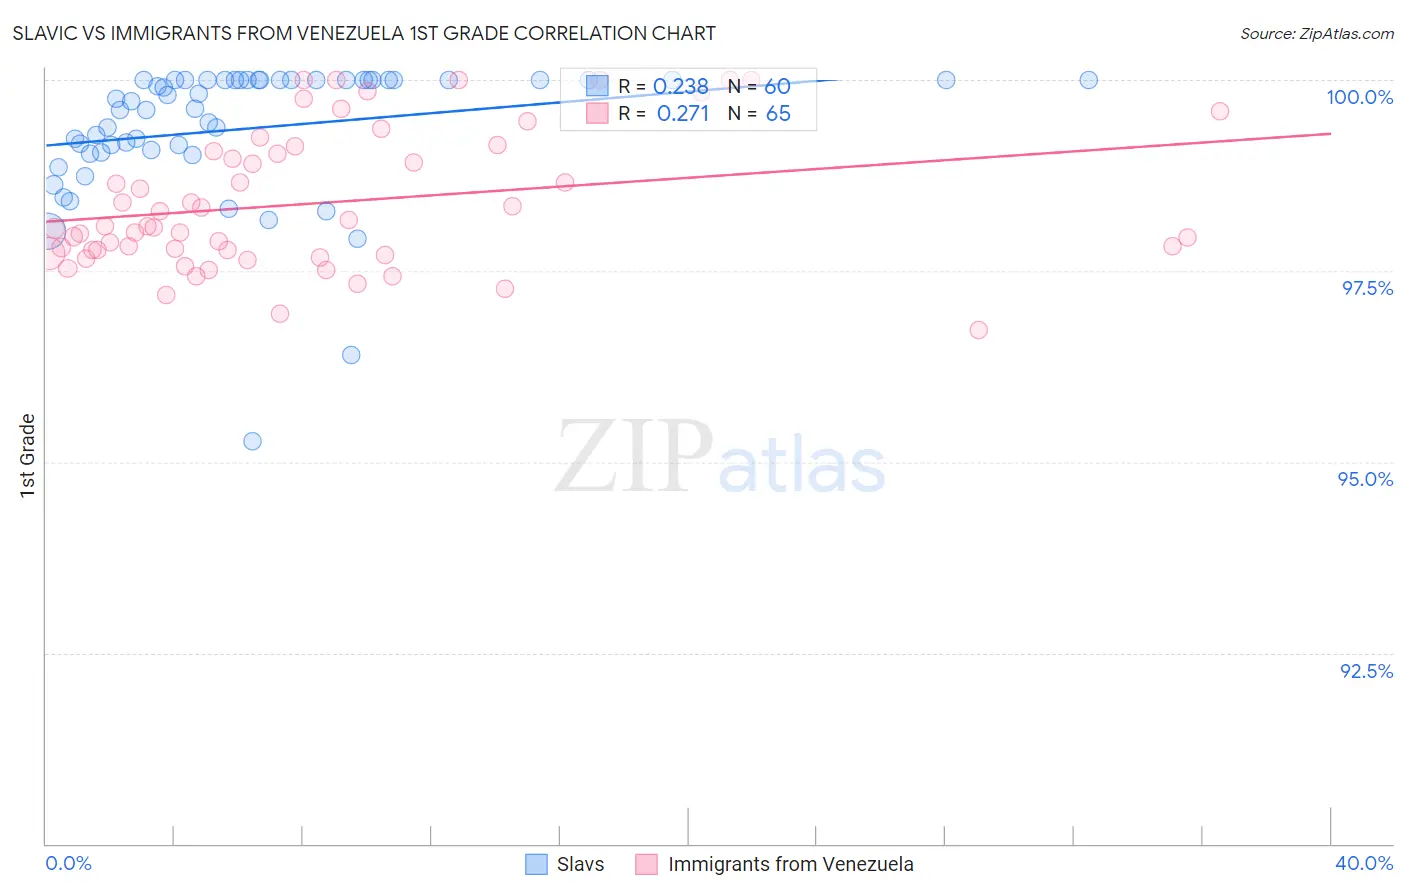
Slavic vs Immigrants from Venezuela 1st Grade Correlation Chart
The statistical analysis conducted on geographies consisting of 270,869,056 people shows a weak positive correlation between the proportion of Slavs and percentage of population with at least 1st grade education in the United States with a correlation coefficient (R) of 0.238 and weighted average of 98.4%. Similarly, the statistical analysis conducted on geographies consisting of 287,866,009 people shows a weak positive correlation between the proportion of Immigrants from Venezuela and percentage of population with at least 1st grade education in the United States with a correlation coefficient (R) of 0.271 and weighted average of 97.9%, a difference of 0.47%.
1st Grade Correlation Summary
| Measurement | Slavic | Immigrants from Venezuela |
| Minimum | 95.3% | 96.7% |
| Maximum | 100.0% | 100.0% |
| Range | 4.7% | 3.3% |
| Mean | 99.4% | 98.4% |
| Median | 99.7% | 98.1% |
| Interquartile 25% (IQ1) | 99.1% | 97.7% |
| Interquartile 75% (IQ3) | 100.0% | 99.1% |
| Interquartile Range (IQR) | 0.93% | 1.4% |
| Standard Deviation (Sample) | 0.90% | 0.89% |
| Standard Deviation (Population) | 0.90% | 0.88% |
Similar Demographics by 1st Grade
Demographics Similar to Slavs by 1st Grade
In terms of 1st grade, the demographic groups most similar to Slavs are New Zealander (98.4%, a difference of 0.0%), Creek (98.4%, a difference of 0.0%), Immigrants from Canada (98.4%, a difference of 0.0%), Bulgarian (98.4%, a difference of 0.0%), and Immigrants from North America (98.4%, a difference of 0.0%).
| Demographics | Rating | Rank | 1st Grade |
| Immigrants | Scotland | 99.8 /100 | #55 | Exceptional 98.4% |
| Americans | 99.8 /100 | #56 | Exceptional 98.4% |
| Austrians | 99.8 /100 | #57 | Exceptional 98.4% |
| New Zealanders | 99.7 /100 | #58 | Exceptional 98.4% |
| Creek | 99.7 /100 | #59 | Exceptional 98.4% |
| Immigrants | Canada | 99.7 /100 | #60 | Exceptional 98.4% |
| Bulgarians | 99.7 /100 | #61 | Exceptional 98.4% |
| Slavs | 99.7 /100 | #62 | Exceptional 98.4% |
| Immigrants | North America | 99.7 /100 | #63 | Exceptional 98.4% |
| Greeks | 99.7 /100 | #64 | Exceptional 98.4% |
| Maltese | 99.7 /100 | #65 | Exceptional 98.4% |
| Canadians | 99.6 /100 | #66 | Exceptional 98.3% |
| Immigrants | Austria | 99.6 /100 | #67 | Exceptional 98.3% |
| Immigrants | Northern Europe | 99.6 /100 | #68 | Exceptional 98.3% |
| Chickasaw | 99.6 /100 | #69 | Exceptional 98.3% |
Demographics Similar to Immigrants from Venezuela by 1st Grade
In terms of 1st grade, the demographic groups most similar to Immigrants from Venezuela are Immigrants from Brazil (97.9%, a difference of 0.0%), Argentinean (97.9%, a difference of 0.0%), Immigrants from Bosnia and Herzegovina (97.9%, a difference of 0.0%), Kenyan (97.9%, a difference of 0.010%), and Native/Alaskan (97.9%, a difference of 0.010%).
| Demographics | Rating | Rank | 1st Grade |
| Immigrants | Jordan | 53.9 /100 | #171 | Average 97.9% |
| Immigrants | Korea | 53.0 /100 | #172 | Average 97.9% |
| Kenyans | 51.2 /100 | #173 | Average 97.9% |
| Natives/Alaskans | 50.0 /100 | #174 | Average 97.9% |
| Immigrants | Sri Lanka | 49.7 /100 | #175 | Average 97.9% |
| Albanians | 49.6 /100 | #176 | Average 97.9% |
| Immigrants | Brazil | 49.1 /100 | #177 | Average 97.9% |
| Immigrants | Venezuela | 47.8 /100 | #178 | Average 97.9% |
| Argentineans | 47.2 /100 | #179 | Average 97.9% |
| Immigrants | Bosnia and Herzegovina | 46.6 /100 | #180 | Average 97.9% |
| Portuguese | 44.2 /100 | #181 | Average 97.9% |
| Egyptians | 42.7 /100 | #182 | Average 97.9% |
| Immigrants | Argentina | 41.3 /100 | #183 | Average 97.9% |
| Immigrants | Poland | 40.1 /100 | #184 | Average 97.9% |
| Immigrants | Belarus | 39.3 /100 | #185 | Fair 97.9% |