Welsh vs Immigrants from Venezuela Median Female Earnings
COMPARE
Welsh
Immigrants from Venezuela
Median Female Earnings
Median Female Earnings Comparison
Welsh
Immigrants from Venezuela
$37,856
MEDIAN FEMALE EARNINGS
2.1/ 100
METRIC RATING
251st/ 347
METRIC RANK
$37,003
MEDIAN FEMALE EARNINGS
0.4/ 100
METRIC RATING
269th/ 347
METRIC RANK
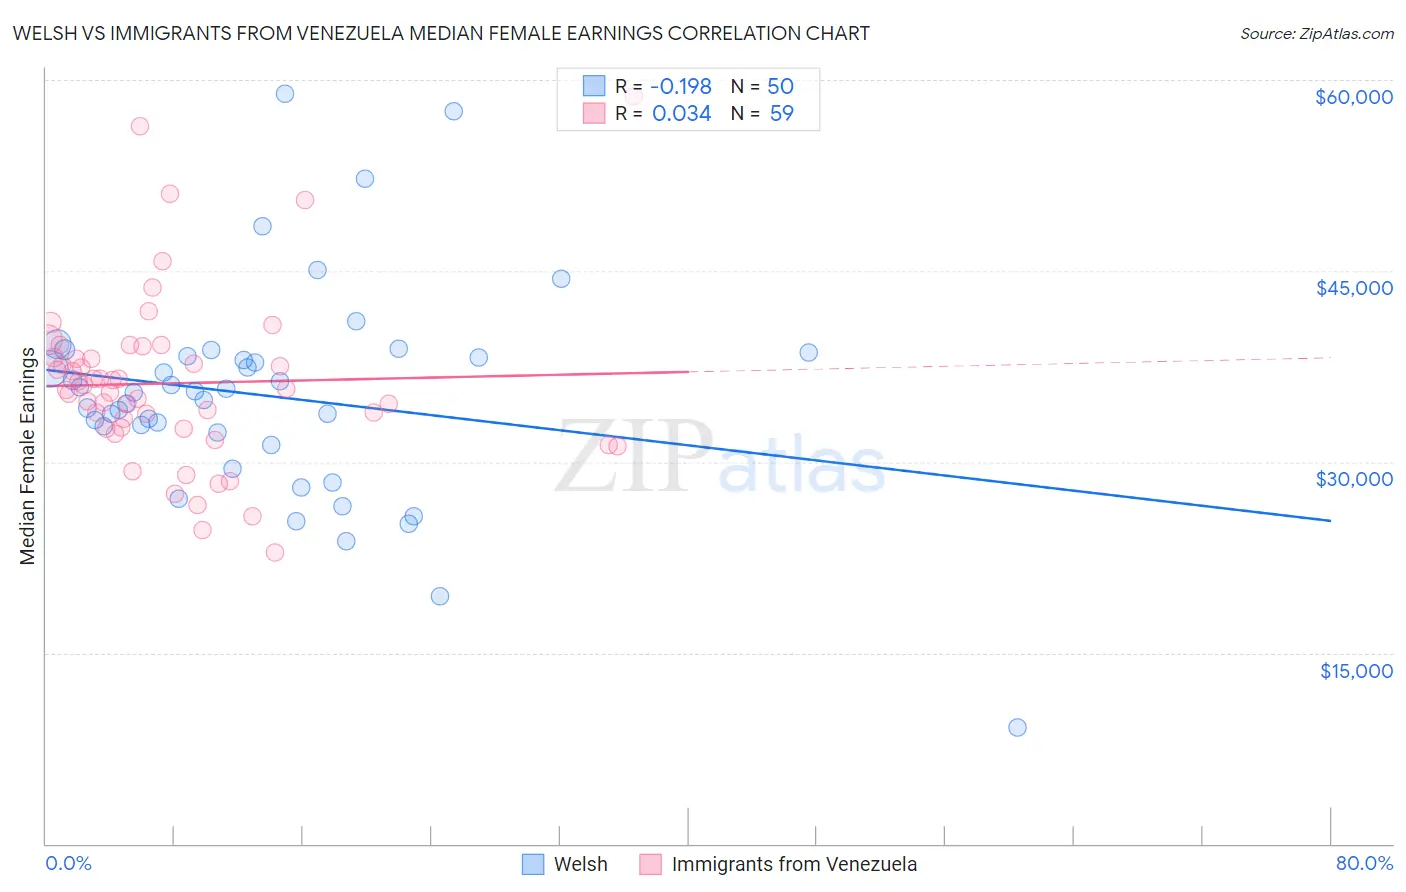
Welsh vs Immigrants from Venezuela Median Female Earnings Correlation Chart
The statistical analysis conducted on geographies consisting of 527,602,521 people shows a poor negative correlation between the proportion of Welsh and median female earnings in the United States with a correlation coefficient (R) of -0.198 and weighted average of $37,856. Similarly, the statistical analysis conducted on geographies consisting of 287,813,755 people shows no correlation between the proportion of Immigrants from Venezuela and median female earnings in the United States with a correlation coefficient (R) of 0.034 and weighted average of $37,003, a difference of 2.3%.
Median Female Earnings Correlation Summary
| Measurement | Welsh | Immigrants from Venezuela |
| Minimum | $9,167 | $22,864 |
| Maximum | $58,927 | $58,709 |
| Range | $49,760 | $35,845 |
| Mean | $35,195 | $36,176 |
| Median | $35,531 | $35,750 |
| Interquartile 25% (IQ1) | $32,290 | $32,617 |
| Interquartile 75% (IQ3) | $38,296 | $38,204 |
| Interquartile Range (IQR) | $6,005 | $5,588 |
| Standard Deviation (Sample) | $8,494 | $6,703 |
| Standard Deviation (Population) | $8,409 | $6,646 |
Demographics Similar to Welsh and Immigrants from Venezuela by Median Female Earnings
In terms of median female earnings, the demographic groups most similar to Welsh are Immigrants from Iraq ($37,864, a difference of 0.020%), Immigrants from Dominica ($37,825, a difference of 0.080%), Danish ($37,730, a difference of 0.33%), White/Caucasian ($37,531, a difference of 0.87%), and Colville ($37,514, a difference of 0.91%). Similarly, the demographic groups most similar to Immigrants from Venezuela are Cree ($37,018, a difference of 0.040%), Nonimmigrants ($37,024, a difference of 0.060%), Dominican ($37,046, a difference of 0.12%), Immigrants from Belize ($37,056, a difference of 0.14%), and Salvadoran ($37,083, a difference of 0.22%).
| Demographics | Rating | Rank | Median Female Earnings |
| Immigrants | Iraq | 2.2 /100 | #250 | Tragic $37,864 |
| Welsh | 2.1 /100 | #251 | Tragic $37,856 |
| Immigrants | Dominica | 2.0 /100 | #252 | Tragic $37,825 |
| Danes | 1.6 /100 | #253 | Tragic $37,730 |
| Whites/Caucasians | 1.1 /100 | #254 | Tragic $37,531 |
| Colville | 1.1 /100 | #255 | Tragic $37,514 |
| Samoans | 1.0 /100 | #256 | Tragic $37,498 |
| Hawaiians | 1.0 /100 | #257 | Tragic $37,497 |
| Belizeans | 0.9 /100 | #258 | Tragic $37,429 |
| Scotch-Irish | 0.8 /100 | #259 | Tragic $37,383 |
| Dutch | 0.7 /100 | #260 | Tragic $37,339 |
| Malaysians | 0.7 /100 | #261 | Tragic $37,298 |
| Venezuelans | 0.7 /100 | #262 | Tragic $37,282 |
| German Russians | 0.5 /100 | #263 | Tragic $37,105 |
| Salvadorans | 0.4 /100 | #264 | Tragic $37,083 |
| Immigrants | Belize | 0.4 /100 | #265 | Tragic $37,056 |
| Dominicans | 0.4 /100 | #266 | Tragic $37,046 |
| Immigrants | Nonimmigrants | 0.4 /100 | #267 | Tragic $37,024 |
| Cree | 0.4 /100 | #268 | Tragic $37,018 |
| Immigrants | Venezuela | 0.4 /100 | #269 | Tragic $37,003 |
| French American Indians | 0.3 /100 | #270 | Tragic $36,920 |