Slavic vs Immigrants from Venezuela 5th Grade
COMPARE
Slavic
Immigrants from Venezuela
5th Grade
5th Grade Comparison
Slavs
Immigrants from Venezuela
98.0%
5TH GRADE
99.8/ 100
METRIC RATING
53rd/ 347
METRIC RANK
97.3%
5TH GRADE
38.4/ 100
METRIC RATING
184th/ 347
METRIC RANK
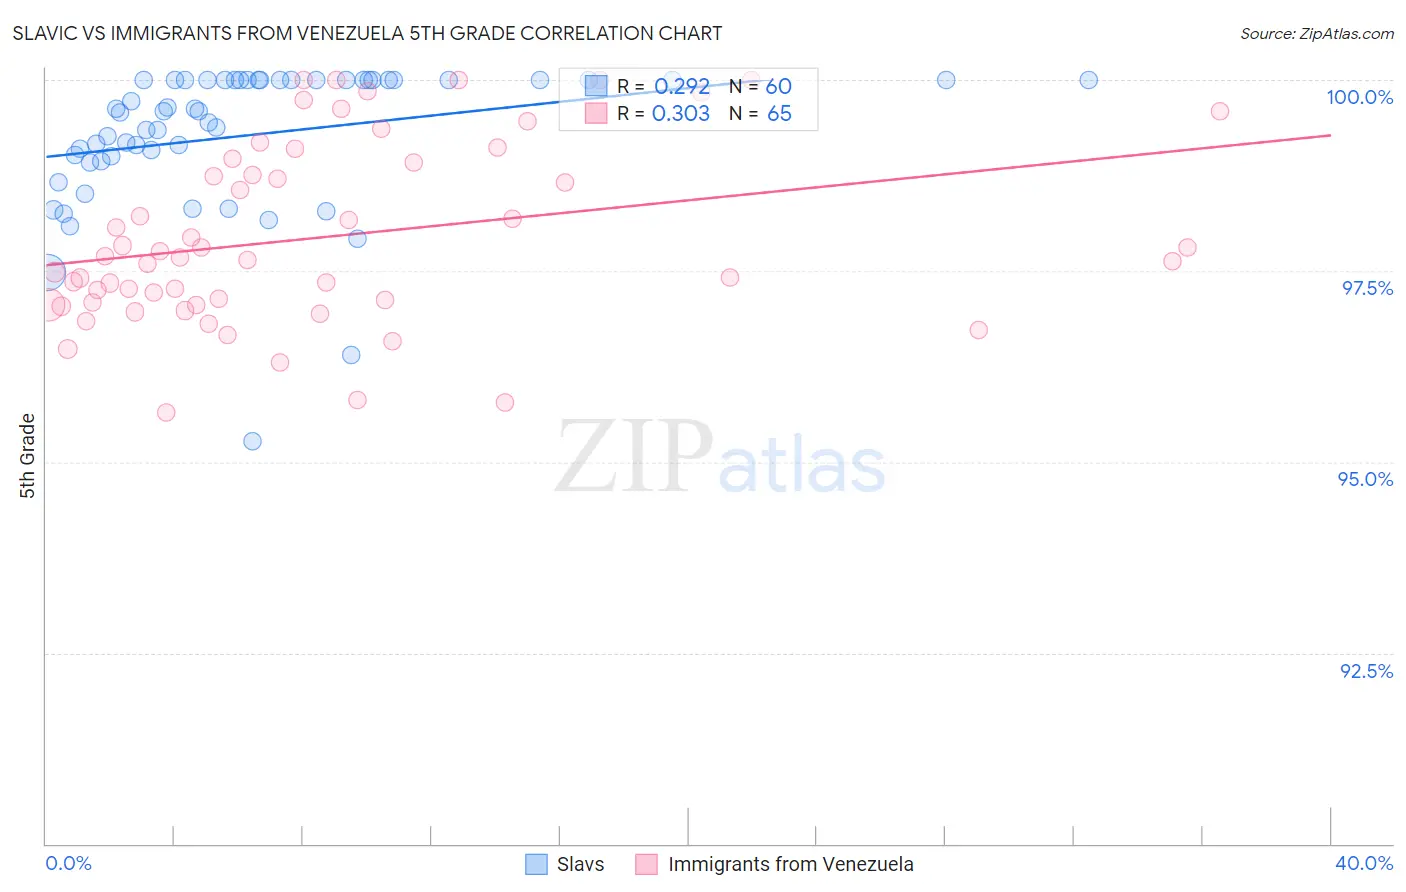
Slavic vs Immigrants from Venezuela 5th Grade Correlation Chart
The statistical analysis conducted on geographies consisting of 270,869,056 people shows a weak positive correlation between the proportion of Slavs and percentage of population with at least 5th grade education in the United States with a correlation coefficient (R) of 0.292 and weighted average of 98.0%. Similarly, the statistical analysis conducted on geographies consisting of 287,866,009 people shows a mild positive correlation between the proportion of Immigrants from Venezuela and percentage of population with at least 5th grade education in the United States with a correlation coefficient (R) of 0.303 and weighted average of 97.3%, a difference of 0.70%.
5th Grade Correlation Summary
| Measurement | Slavic | Immigrants from Venezuela |
| Minimum | 95.3% | 95.6% |
| Maximum | 100.0% | 100.0% |
| Range | 4.7% | 4.4% |
| Mean | 99.3% | 97.9% |
| Median | 99.6% | 97.7% |
| Interquartile 25% (IQ1) | 99.0% | 97.1% |
| Interquartile 75% (IQ3) | 100.0% | 99.0% |
| Interquartile Range (IQR) | 1.0% | 1.9% |
| Standard Deviation (Sample) | 0.94% | 1.2% |
| Standard Deviation (Population) | 0.93% | 1.2% |
Similar Demographics by 5th Grade
Demographics Similar to Slavs by 5th Grade
In terms of 5th grade, the demographic groups most similar to Slavs are Maltese (98.0%, a difference of 0.0%), Estonian (98.0%, a difference of 0.010%), Immigrants from Scotland (98.0%, a difference of 0.010%), Celtic (98.0%, a difference of 0.010%), and Australian (98.0%, a difference of 0.010%).
| Demographics | Rating | Rank | 5th Grade |
| Arapaho | 99.9 /100 | #46 | Exceptional 98.0% |
| Native Hawaiians | 99.9 /100 | #47 | Exceptional 98.0% |
| Bulgarians | 99.8 /100 | #48 | Exceptional 98.0% |
| Estonians | 99.8 /100 | #49 | Exceptional 98.0% |
| Immigrants | Scotland | 99.8 /100 | #50 | Exceptional 98.0% |
| Celtics | 99.8 /100 | #51 | Exceptional 98.0% |
| Maltese | 99.8 /100 | #52 | Exceptional 98.0% |
| Slavs | 99.8 /100 | #53 | Exceptional 98.0% |
| Australians | 99.8 /100 | #54 | Exceptional 98.0% |
| Creek | 99.8 /100 | #55 | Exceptional 98.0% |
| Greeks | 99.8 /100 | #56 | Exceptional 97.9% |
| Austrians | 99.8 /100 | #57 | Exceptional 97.9% |
| Whites/Caucasians | 99.8 /100 | #58 | Exceptional 97.9% |
| Americans | 99.7 /100 | #59 | Exceptional 97.9% |
| Immigrants | Canada | 99.7 /100 | #60 | Exceptional 97.9% |
Demographics Similar to Immigrants from Venezuela by 5th Grade
In terms of 5th grade, the demographic groups most similar to Immigrants from Venezuela are Mongolian (97.3%, a difference of 0.0%), Immigrants from Ukraine (97.3%, a difference of 0.0%), Immigrants from Kenya (97.3%, a difference of 0.010%), Pakistani (97.3%, a difference of 0.010%), and Argentinean (97.3%, a difference of 0.010%).
| Demographics | Rating | Rank | 5th Grade |
| Immigrants | Spain | 47.0 /100 | #177 | Average 97.3% |
| Comanche | 42.1 /100 | #178 | Average 97.3% |
| Immigrants | Kenya | 40.3 /100 | #179 | Average 97.3% |
| Pakistanis | 40.2 /100 | #180 | Average 97.3% |
| Argentineans | 39.5 /100 | #181 | Fair 97.3% |
| Mongolians | 39.4 /100 | #182 | Fair 97.3% |
| Immigrants | Ukraine | 38.6 /100 | #183 | Fair 97.3% |
| Immigrants | Venezuela | 38.4 /100 | #184 | Fair 97.3% |
| Dutch West Indians | 36.2 /100 | #185 | Fair 97.3% |
| Immigrants | Argentina | 36.1 /100 | #186 | Fair 97.3% |
| Spanish Americans | 34.7 /100 | #187 | Fair 97.3% |
| Paraguayans | 33.7 /100 | #188 | Fair 97.3% |
| Immigrants | Egypt | 32.9 /100 | #189 | Fair 97.3% |
| Blacks/African Americans | 31.8 /100 | #190 | Fair 97.3% |
| Immigrants | Brazil | 31.5 /100 | #191 | Fair 97.3% |