Slavic vs Immigrants from Micronesia Per Capita Income
COMPARE
Slavic
Immigrants from Micronesia
Per Capita Income
Per Capita Income Comparison
Slavs
Immigrants from Micronesia
$45,049
PER CAPITA INCOME
82.6/ 100
METRIC RATING
141st/ 347
METRIC RANK
$37,464
PER CAPITA INCOME
0.1/ 100
METRIC RATING
292nd/ 347
METRIC RANK
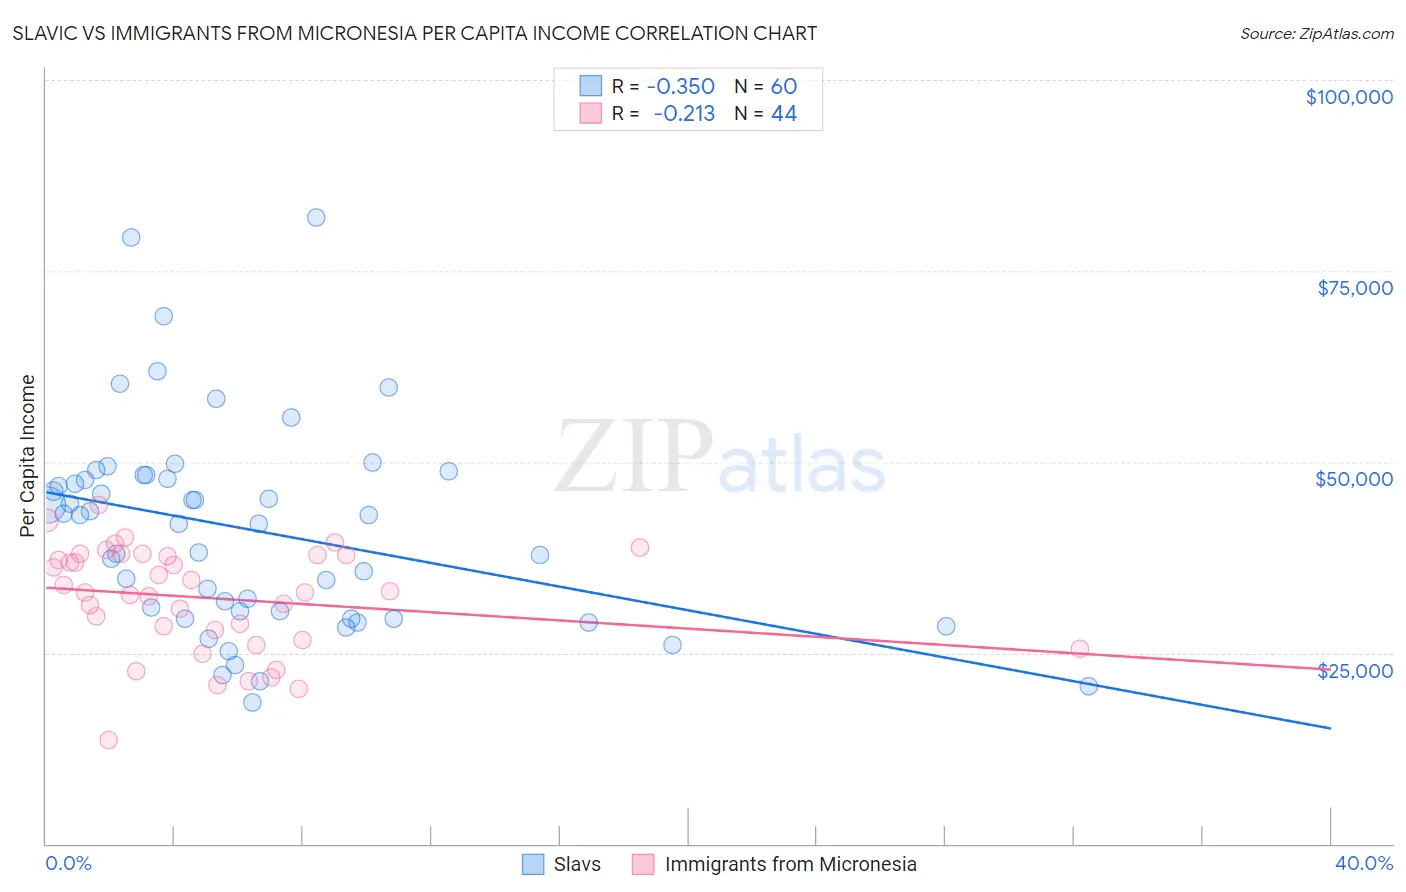
Slavic vs Immigrants from Micronesia Per Capita Income Correlation Chart
The statistical analysis conducted on geographies consisting of 270,856,611 people shows a mild negative correlation between the proportion of Slavs and per capita income in the United States with a correlation coefficient (R) of -0.350 and weighted average of $45,049. Similarly, the statistical analysis conducted on geographies consisting of 61,609,499 people shows a weak negative correlation between the proportion of Immigrants from Micronesia and per capita income in the United States with a correlation coefficient (R) of -0.213 and weighted average of $37,464, a difference of 20.3%.
Per Capita Income Correlation Summary
| Measurement | Slavic | Immigrants from Micronesia |
| Minimum | $18,507 | $13,631 |
| Maximum | $81,943 | $44,421 |
| Range | $63,436 | $30,790 |
| Mean | $41,079 | $32,171 |
| Median | $42,528 | $32,971 |
| Interquartile 25% (IQ1) | $30,000 | $27,332 |
| Interquartile 75% (IQ3) | $48,077 | $37,862 |
| Interquartile Range (IQR) | $18,077 | $10,531 |
| Standard Deviation (Sample) | $13,481 | $6,923 |
| Standard Deviation (Population) | $13,368 | $6,844 |
Similar Demographics by Per Capita Income
Demographics Similar to Slavs by Per Capita Income
In terms of per capita income, the demographic groups most similar to Slavs are Ugandan ($45,047, a difference of 0.0%), Immigrants from Uganda ($45,043, a difference of 0.010%), Immigrants from Jordan ($45,066, a difference of 0.040%), Basque ($45,086, a difference of 0.080%), and Icelander ($44,987, a difference of 0.14%).
| Demographics | Rating | Rank | Per Capita Income |
| Slovenes | 89.6 /100 | #134 | Excellent $45,581 |
| Hungarians | 87.9 /100 | #135 | Excellent $45,426 |
| Immigrants | Oceania | 85.2 /100 | #136 | Excellent $45,220 |
| Immigrants | Syria | 85.2 /100 | #137 | Excellent $45,218 |
| Assyrians/Chaldeans/Syriacs | 84.8 /100 | #138 | Excellent $45,195 |
| Basques | 83.2 /100 | #139 | Excellent $45,086 |
| Immigrants | Jordan | 82.9 /100 | #140 | Excellent $45,066 |
| Slavs | 82.6 /100 | #141 | Excellent $45,049 |
| Ugandans | 82.6 /100 | #142 | Excellent $45,047 |
| Immigrants | Uganda | 82.5 /100 | #143 | Excellent $45,043 |
| Icelanders | 81.6 /100 | #144 | Excellent $44,987 |
| Immigrants | Afghanistan | 78.0 /100 | #145 | Good $44,790 |
| Irish | 75.8 /100 | #146 | Good $44,679 |
| Czechs | 74.1 /100 | #147 | Good $44,595 |
| Immigrants | Armenia | 73.1 /100 | #148 | Good $44,552 |
Demographics Similar to Immigrants from Micronesia by Per Capita Income
In terms of per capita income, the demographic groups most similar to Immigrants from Micronesia are Mexican American Indian ($37,407, a difference of 0.15%), Cajun ($37,527, a difference of 0.17%), Cuban ($37,383, a difference of 0.22%), Immigrants from Guatemala ($37,550, a difference of 0.23%), and U.S. Virgin Islander ($37,589, a difference of 0.33%).
| Demographics | Rating | Rank | Per Capita Income |
| Guatemalans | 0.1 /100 | #285 | Tragic $37,766 |
| Central American Indians | 0.1 /100 | #286 | Tragic $37,699 |
| Dominicans | 0.1 /100 | #287 | Tragic $37,697 |
| Blackfeet | 0.1 /100 | #288 | Tragic $37,695 |
| U.S. Virgin Islanders | 0.1 /100 | #289 | Tragic $37,589 |
| Immigrants | Guatemala | 0.1 /100 | #290 | Tragic $37,550 |
| Cajuns | 0.1 /100 | #291 | Tragic $37,527 |
| Immigrants | Micronesia | 0.1 /100 | #292 | Tragic $37,464 |
| Mexican American Indians | 0.1 /100 | #293 | Tragic $37,407 |
| Cubans | 0.1 /100 | #294 | Tragic $37,383 |
| Immigrants | Dominican Republic | 0.1 /100 | #295 | Tragic $37,306 |
| Indonesians | 0.1 /100 | #296 | Tragic $37,300 |
| Haitians | 0.1 /100 | #297 | Tragic $37,289 |
| Immigrants | Caribbean | 0.1 /100 | #298 | Tragic $37,254 |
| Cherokee | 0.1 /100 | #299 | Tragic $37,203 |