Slavic vs Immigrants from Micronesia Doctorate Degree
COMPARE
Slavic
Immigrants from Micronesia
Doctorate Degree
Doctorate Degree Comparison
Slavs
Immigrants from Micronesia
1.9%
DOCTORATE DEGREE
72.4/ 100
METRIC RATING
156th/ 347
METRIC RANK
1.3%
DOCTORATE DEGREE
0.1/ 100
METRIC RATING
317th/ 347
METRIC RANK
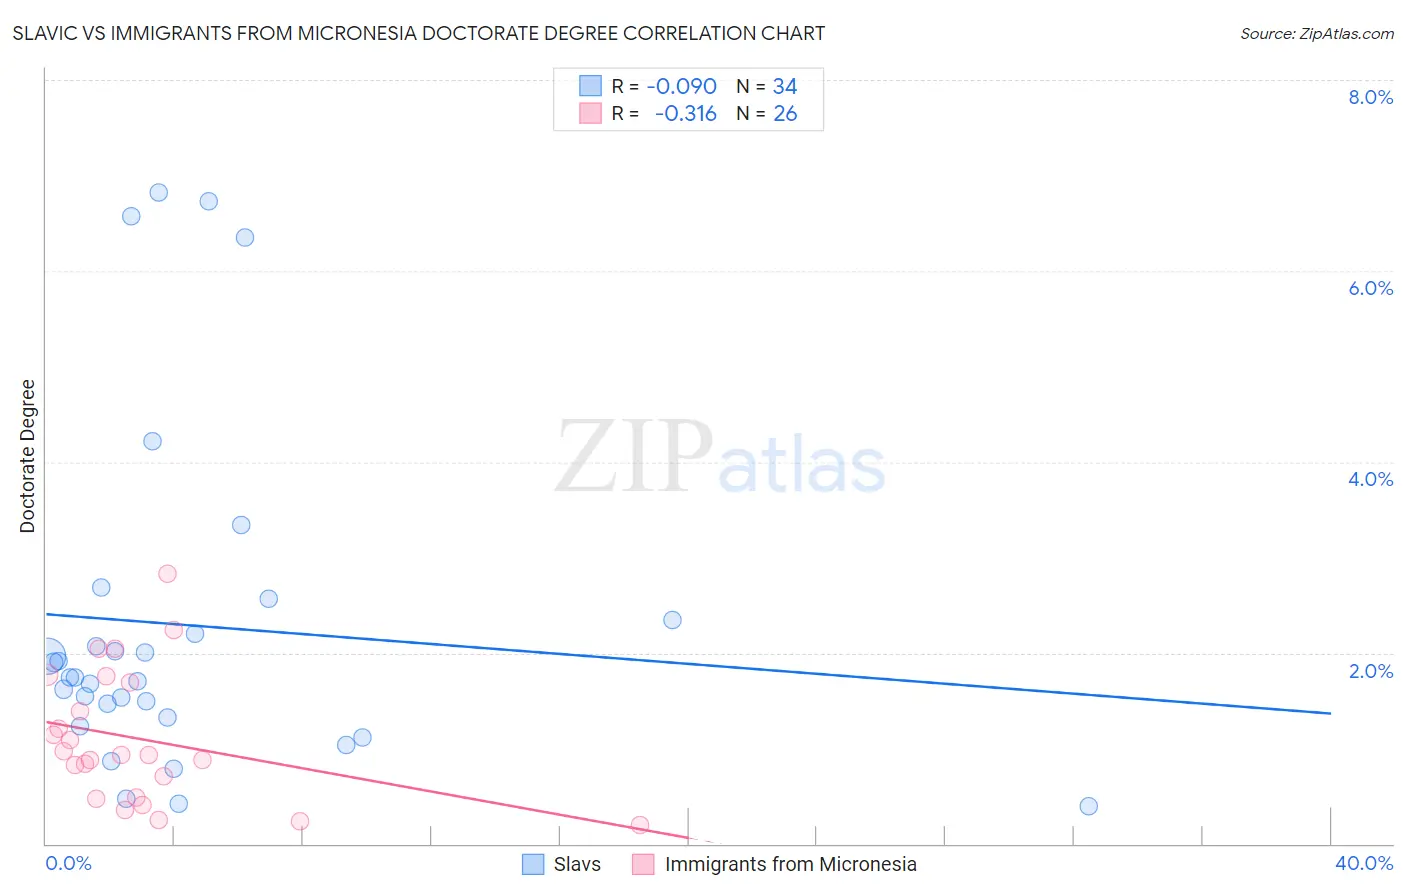
Slavic vs Immigrants from Micronesia Doctorate Degree Correlation Chart
The statistical analysis conducted on geographies consisting of 269,161,958 people shows a slight negative correlation between the proportion of Slavs and percentage of population with at least doctorate degree education in the United States with a correlation coefficient (R) of -0.090 and weighted average of 1.9%. Similarly, the statistical analysis conducted on geographies consisting of 61,316,353 people shows a mild negative correlation between the proportion of Immigrants from Micronesia and percentage of population with at least doctorate degree education in the United States with a correlation coefficient (R) of -0.316 and weighted average of 1.3%, a difference of 41.3%.
Doctorate Degree Correlation Summary
| Measurement | Slavic | Immigrants from Micronesia |
| Minimum | 0.39% | 0.19% |
| Maximum | 6.8% | 2.8% |
| Range | 6.4% | 2.6% |
| Mean | 2.3% | 1.1% |
| Median | 1.7% | 0.93% |
| Interquartile 25% (IQ1) | 1.3% | 0.49% |
| Interquartile 75% (IQ3) | 2.3% | 1.7% |
| Interquartile Range (IQR) | 1.0% | 1.2% |
| Standard Deviation (Sample) | 1.8% | 0.69% |
| Standard Deviation (Population) | 1.8% | 0.68% |
Similar Demographics by Doctorate Degree
Demographics Similar to Slavs by Doctorate Degree
In terms of doctorate degree, the demographic groups most similar to Slavs are Polish (1.9%, a difference of 0.060%), Immigrants from Albania (1.9%, a difference of 0.080%), Danish (1.9%, a difference of 0.090%), Hungarian (1.9%, a difference of 0.11%), and Immigrants from Oceania (1.9%, a difference of 0.30%).
| Demographics | Rating | Rank | Doctorate Degree |
| Basques | 76.9 /100 | #149 | Good 1.9% |
| English | 75.9 /100 | #150 | Good 1.9% |
| Albanians | 74.8 /100 | #151 | Good 1.9% |
| Immigrants | Kenya | 74.3 /100 | #152 | Good 1.9% |
| Immigrants | Oceania | 74.0 /100 | #153 | Good 1.9% |
| Immigrants | Albania | 72.8 /100 | #154 | Good 1.9% |
| Poles | 72.7 /100 | #155 | Good 1.9% |
| Slavs | 72.4 /100 | #156 | Good 1.9% |
| Danes | 71.9 /100 | #157 | Good 1.9% |
| Hungarians | 71.7 /100 | #158 | Good 1.9% |
| Slovenes | 70.2 /100 | #159 | Good 1.9% |
| Welsh | 69.7 /100 | #160 | Good 1.9% |
| Immigrants | Middle Africa | 68.8 /100 | #161 | Good 1.9% |
| Irish | 67.5 /100 | #162 | Good 1.9% |
| Czechs | 67.3 /100 | #163 | Good 1.9% |
Demographics Similar to Immigrants from Micronesia by Doctorate Degree
In terms of doctorate degree, the demographic groups most similar to Immigrants from Micronesia are Creek (1.3%, a difference of 0.050%), Navajo (1.4%, a difference of 0.25%), Immigrants from the Azores (1.4%, a difference of 0.45%), Dominican (1.4%, a difference of 0.48%), and Menominee (1.4%, a difference of 0.55%).
| Demographics | Rating | Rank | Doctorate Degree |
| Immigrants | Jamaica | 0.1 /100 | #310 | Tragic 1.4% |
| Immigrants | Honduras | 0.1 /100 | #311 | Tragic 1.4% |
| Immigrants | Nicaragua | 0.1 /100 | #312 | Tragic 1.4% |
| Menominee | 0.1 /100 | #313 | Tragic 1.4% |
| Dominicans | 0.1 /100 | #314 | Tragic 1.4% |
| Immigrants | Azores | 0.1 /100 | #315 | Tragic 1.4% |
| Navajo | 0.1 /100 | #316 | Tragic 1.4% |
| Immigrants | Micronesia | 0.1 /100 | #317 | Tragic 1.3% |
| Creek | 0.1 /100 | #318 | Tragic 1.3% |
| Immigrants | Guyana | 0.1 /100 | #319 | Tragic 1.3% |
| Immigrants | St. Vincent and the Grenadines | 0.1 /100 | #320 | Tragic 1.3% |
| Dutch West Indians | 0.1 /100 | #321 | Tragic 1.3% |
| Seminole | 0.1 /100 | #322 | Tragic 1.3% |
| Immigrants | Belize | 0.1 /100 | #323 | Tragic 1.3% |
| Natives/Alaskans | 0.0 /100 | #324 | Tragic 1.3% |