Slavic vs Mexican Per Capita Income
COMPARE
Slavic
Mexican
Per Capita Income
Per Capita Income Comparison
Slavs
Mexicans
$45,049
PER CAPITA INCOME
82.6/ 100
METRIC RATING
141st/ 347
METRIC RANK
$34,559
PER CAPITA INCOME
0.0/ 100
METRIC RATING
329th/ 347
METRIC RANK
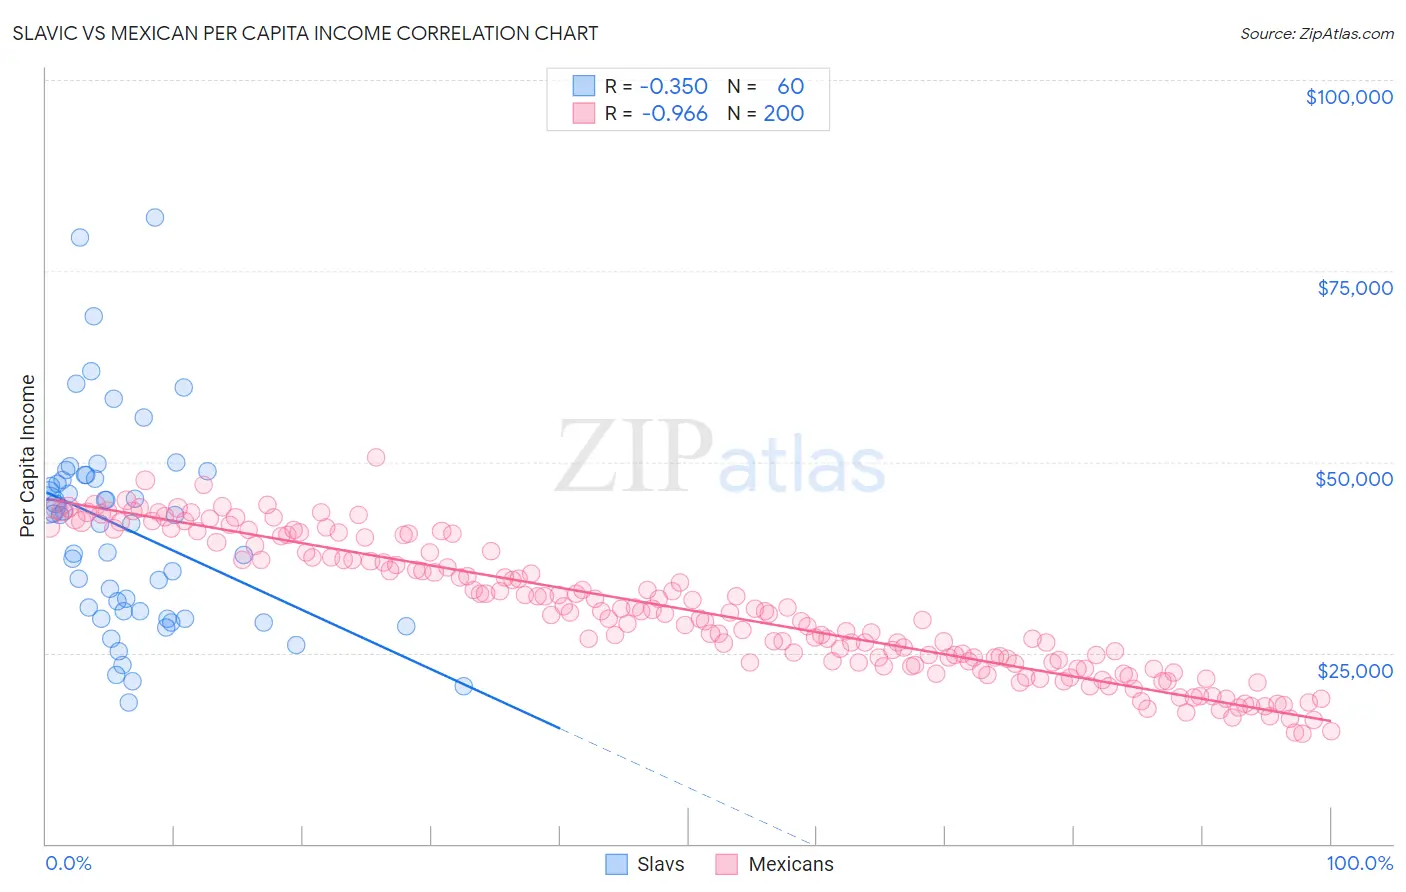
Slavic vs Mexican Per Capita Income Correlation Chart
The statistical analysis conducted on geographies consisting of 270,856,611 people shows a mild negative correlation between the proportion of Slavs and per capita income in the United States with a correlation coefficient (R) of -0.350 and weighted average of $45,049. Similarly, the statistical analysis conducted on geographies consisting of 565,389,845 people shows a perfect negative correlation between the proportion of Mexicans and per capita income in the United States with a correlation coefficient (R) of -0.966 and weighted average of $34,559, a difference of 30.3%.
Per Capita Income Correlation Summary
| Measurement | Slavic | Mexican |
| Minimum | $18,507 | $14,444 |
| Maximum | $81,943 | $50,649 |
| Range | $63,436 | $36,205 |
| Mean | $41,079 | $30,602 |
| Median | $42,528 | $30,143 |
| Interquartile 25% (IQ1) | $30,000 | $23,673 |
| Interquartile 75% (IQ3) | $48,077 | $38,169 |
| Interquartile Range (IQR) | $18,077 | $14,496 |
| Standard Deviation (Sample) | $13,481 | $8,722 |
| Standard Deviation (Population) | $13,368 | $8,700 |
Similar Demographics by Per Capita Income
Demographics Similar to Slavs by Per Capita Income
In terms of per capita income, the demographic groups most similar to Slavs are Ugandan ($45,047, a difference of 0.0%), Immigrants from Uganda ($45,043, a difference of 0.010%), Immigrants from Jordan ($45,066, a difference of 0.040%), Basque ($45,086, a difference of 0.080%), and Icelander ($44,987, a difference of 0.14%).
| Demographics | Rating | Rank | Per Capita Income |
| Slovenes | 89.6 /100 | #134 | Excellent $45,581 |
| Hungarians | 87.9 /100 | #135 | Excellent $45,426 |
| Immigrants | Oceania | 85.2 /100 | #136 | Excellent $45,220 |
| Immigrants | Syria | 85.2 /100 | #137 | Excellent $45,218 |
| Assyrians/Chaldeans/Syriacs | 84.8 /100 | #138 | Excellent $45,195 |
| Basques | 83.2 /100 | #139 | Excellent $45,086 |
| Immigrants | Jordan | 82.9 /100 | #140 | Excellent $45,066 |
| Slavs | 82.6 /100 | #141 | Excellent $45,049 |
| Ugandans | 82.6 /100 | #142 | Excellent $45,047 |
| Immigrants | Uganda | 82.5 /100 | #143 | Excellent $45,043 |
| Icelanders | 81.6 /100 | #144 | Excellent $44,987 |
| Immigrants | Afghanistan | 78.0 /100 | #145 | Good $44,790 |
| Irish | 75.8 /100 | #146 | Good $44,679 |
| Czechs | 74.1 /100 | #147 | Good $44,595 |
| Immigrants | Armenia | 73.1 /100 | #148 | Good $44,552 |
Demographics Similar to Mexicans by Per Capita Income
In terms of per capita income, the demographic groups most similar to Mexicans are Menominee ($34,578, a difference of 0.060%), Apache ($34,886, a difference of 0.95%), Immigrants from Cuba ($34,910, a difference of 1.0%), Spanish American Indian ($34,195, a difference of 1.1%), and Immigrants from Central America ($34,974, a difference of 1.2%).
| Demographics | Rating | Rank | Per Capita Income |
| Creek | 0.0 /100 | #322 | Tragic $35,546 |
| Cheyenne | 0.0 /100 | #323 | Tragic $35,276 |
| Kiowa | 0.0 /100 | #324 | Tragic $35,102 |
| Immigrants | Central America | 0.0 /100 | #325 | Tragic $34,974 |
| Immigrants | Cuba | 0.0 /100 | #326 | Tragic $34,910 |
| Apache | 0.0 /100 | #327 | Tragic $34,886 |
| Menominee | 0.0 /100 | #328 | Tragic $34,578 |
| Mexicans | 0.0 /100 | #329 | Tragic $34,559 |
| Spanish American Indians | 0.0 /100 | #330 | Tragic $34,195 |
| Immigrants | Mexico | 0.0 /100 | #331 | Tragic $33,931 |
| Sioux | 0.0 /100 | #332 | Tragic $33,921 |
| Immigrants | Yemen | 0.0 /100 | #333 | Tragic $33,696 |
| Natives/Alaskans | 0.0 /100 | #334 | Tragic $33,279 |
| Yuman | 0.0 /100 | #335 | Tragic $33,236 |
| Yakama | 0.0 /100 | #336 | Tragic $33,009 |