Slavic vs Swiss Per Capita Income

COMPARE

Slavic
Race
Ancestry
AfghanAfricanAlaska NativeAlaskan AthabascanAlbanianAleutAlsatianAmericanApacheArabArapahoArgentineanArmenianAssyrian/Chaldean/SyriacAustralianAustrianBahamianBangladeshiBarbadianBasqueBelgianBelizeanBermudanBhutaneseBlackfeetBolivianBrazilianBritishBritish West IndianBulgarianBurmeseCajunCambodianCanadianCape VerdeanCarpatho RusynCelticCentral AmericanCentral American IndianCherokeeCheyenneChickasawChileanChineseChippewaChoctawColombianColvilleComancheCosta RicanCreeCreekCroatianCrowCubanCypriotCzechCzechoslovakianDanishDelawareDominicanDutchDutch West IndianEastern EuropeanEcuadorianEgyptianEnglishEstonianEthiopianEuropeanFijianFilipinoFinnishFrenchFrench American IndianFrench CanadianGermanGerman RussianGhanaianGreekGuamanian/ChamorroGuatemalanGuyaneseHaitianHmongHonduranHopiHoumaHungarianIcelanderIndian (Asian)IndonesianInupiatIranianIraqiIrishIroquoisIsraeliItalianJamaicanJapaneseJordanianKenyanKiowaKoreanLaotianLatvianLebaneseLiberianLithuanianLumbeeLuxembourgerMacedonianMalaysianMalteseMarshalleseMenomineeMexicanMexican American IndianMongolianMoroccanNative HawaiianNavajoNepaleseNew ZealanderNicaraguanNigerianNorthern EuropeanNorwegianOkinawanOsageOttawaPaiutePakistaniPalestinianPanamanianParaguayanPennsylvania GermanPeruvianPimaPolishPortuguesePotawatomiPuebloPuerto RicanPuget Sound SalishRomanianRussianSalvadoranSamoanScandinavianScotch-IrishScottishSeminoleSenegaleseSerbianShoshoneSierra LeoneanSiouxSlavicSlovakSloveneSomaliSouth AfricanSouth AmericanSouth American IndianSoviet UnionSpaniardSpanishSpanish AmericanSpanish American IndianSri LankanSubsaharan AfricanSudaneseSwedishSyrianTaiwaneseThaiTlingit-HaidaTohono O'OdhamTonganTrinidadian and TobagonianTsimshianTurkishU.S. Virgin IslanderUgandanUkrainianUruguayanUteVenezuelanVietnameseWelshWest IndianYakamaYaquiYugoslavianYumanYup'ikZimbabwean
Immigration
NonimmigrantsImmigrantsAfghanistanAfricaAlbaniaArgentinaArmeniaAsiaAustraliaAustriaBahamasBangladeshBarbadosBelarusBelgiumBelizeBoliviaBosnia and HerzegovinaBrazilBulgariaBurma/MyanmarCabo VerdeCambodiaCameroonCanadaCaribbeanCentral AmericaChileChinaColombiaCongoCosta RicaCroatiaCubaCzechoslovakiaDenmarkDominicaDominican RepublicEastern AfricaEastern AsiaEastern EuropeEcuadorEgyptEl SalvadorEnglandEritreaEthiopiaEuropeFijiFranceGermanyGhanaGreeceGrenadaGuatemalaGuyanaHaitiHondurasHong KongHungaryIndiaIndonesiaIranIraqIrelandIsraelItalyJamaicaJapanJordanKazakhstanKenyaKoreaKuwaitLaosLatin AmericaLatviaLebanonLiberiaLithuaniaMalaysiaMexicoMicronesiaMiddle AfricaMoldovaMoroccoNepalNetherlandsNicaraguaNigeriaNorth AmericaNorth MacedoniaNorthern AfricaNorthern EuropeNorwayOceaniaPakistanPanamaPeruPhilippinesPolandPortugalRomaniaRussiaSaudi ArabiaScotlandSenegalSerbiaSierra LeoneSingaporeSomaliaSouth AfricaSouth AmericaSouth Central AsiaSouth Eastern AsiaSouthern EuropeSpainSri LankaSt. Vincent and the GrenadinesSudanSwedenSwitzerlandSyriaTaiwanThailandTrinidad and TobagoTurkeyUgandaUkraineUruguayUzbekistanVenezuelaVietnamWest IndiesWestern AfricaWestern AsiaWestern EuropeYemenZaireZimbabweAzores
Swiss
Race
Ancestry
AfghanAfricanAlaska NativeAlaskan AthabascanAlbanianAleutAlsatianAmericanApacheArabArapahoArgentineanArmenianAssyrian/Chaldean/SyriacAustralianAustrianBahamianBangladeshiBarbadianBasqueBelgianBelizeanBermudanBhutaneseBlackfeetBolivianBrazilianBritishBritish West IndianBulgarianBurmeseCajunCambodianCanadianCape VerdeanCarpatho RusynCelticCentral AmericanCentral American IndianCherokeeCheyenneChickasawChileanChineseChippewaChoctawColombianColvilleComancheCosta RicanCreeCreekCroatianCrowCubanCypriotCzechCzechoslovakianDanishDelawareDominicanDutchDutch West IndianEastern EuropeanEcuadorianEgyptianEnglishEstonianEthiopianEuropeanFijianFilipinoFinnishFrenchFrench American IndianFrench CanadianGermanGerman RussianGhanaianGreekGuamanian/ChamorroGuatemalanGuyaneseHaitianHmongHonduranHopiHoumaHungarianIcelanderIndian (Asian)IndonesianInupiatIranianIraqiIrishIroquoisIsraeliItalianJamaicanJapaneseJordanianKenyanKiowaKoreanLaotianLatvianLebaneseLiberianLithuanianLumbeeLuxembourgerMacedonianMalaysianMalteseMarshalleseMenomineeMexicanMexican American IndianMongolianMoroccanNative HawaiianNavajoNepaleseNew ZealanderNicaraguanNigerianNorthern EuropeanNorwegianOkinawanOsageOttawaPaiutePakistaniPalestinianPanamanianParaguayanPennsylvania GermanPeruvianPimaPolishPortuguesePotawatomiPuebloPuerto RicanPuget Sound SalishRomanianRussianSalvadoranSamoanScandinavianScotch-IrishScottishSeminoleSenegaleseSerbianShoshoneSierra LeoneanSiouxSlovakSloveneSomaliSouth AfricanSouth AmericanSouth American IndianSoviet UnionSpaniardSpanishSpanish AmericanSpanish American IndianSri LankanSubsaharan AfricanSudaneseSwedishSwissSyrianTaiwaneseThaiTlingit-HaidaTohono O'OdhamTonganTrinidadian and TobagonianTsimshianTurkishU.S. Virgin IslanderUgandanUkrainianUruguayanUteVenezuelanVietnameseWelshWest IndianYakamaYaquiYugoslavianYumanYup'ikZimbabwean
Immigration
NonimmigrantsImmigrantsAfghanistanAfricaAlbaniaArgentinaArmeniaAsiaAustraliaAustriaBahamasBangladeshBarbadosBelarusBelgiumBelizeBoliviaBosnia and HerzegovinaBrazilBulgariaBurma/MyanmarCabo VerdeCambodiaCameroonCanadaCaribbeanCentral AmericaChileChinaColombiaCongoCosta RicaCroatiaCubaCzechoslovakiaDenmarkDominicaDominican RepublicEastern AfricaEastern AsiaEastern EuropeEcuadorEgyptEl SalvadorEnglandEritreaEthiopiaEuropeFijiFranceGermanyGhanaGreeceGrenadaGuatemalaGuyanaHaitiHondurasHong KongHungaryIndiaIndonesiaIranIraqIrelandIsraelItalyJamaicaJapanJordanKazakhstanKenyaKoreaKuwaitLaosLatin AmericaLatviaLebanonLiberiaLithuaniaMalaysiaMexicoMicronesiaMiddle AfricaMoldovaMoroccoNepalNetherlandsNicaraguaNigeriaNorth AmericaNorth MacedoniaNorthern AfricaNorthern EuropeNorwayOceaniaPakistanPanamaPeruPhilippinesPolandPortugalRomaniaRussiaSaudi ArabiaScotlandSenegalSerbiaSierra LeoneSingaporeSomaliaSouth AfricaSouth AmericaSouth Central AsiaSouth Eastern AsiaSouthern EuropeSpainSri LankaSt. Vincent and the GrenadinesSudanSwedenSwitzerlandSyriaTaiwanThailandTrinidad and TobagoTurkeyUgandaUkraineUruguayUzbekistanVenezuelaVietnamWest IndiesWestern AfricaWestern AsiaWestern EuropeYemenZaireZimbabweAzores
Per Capita Income
Income
Poverty
Unemployment
Labor Participation
Family Structure
Vehicle Availability
Education Level
Disability

Per Capita Income Comparison

Slavs

Swiss

Excellent
Good
$45,049
PER CAPITA INCOME
82.6/ 100
METRIC RATING
141st/ 347
METRIC RANK
$44,076
PER CAPITA INCOME
61.4/ 100
METRIC RATING
162nd/ 347
METRIC RANK

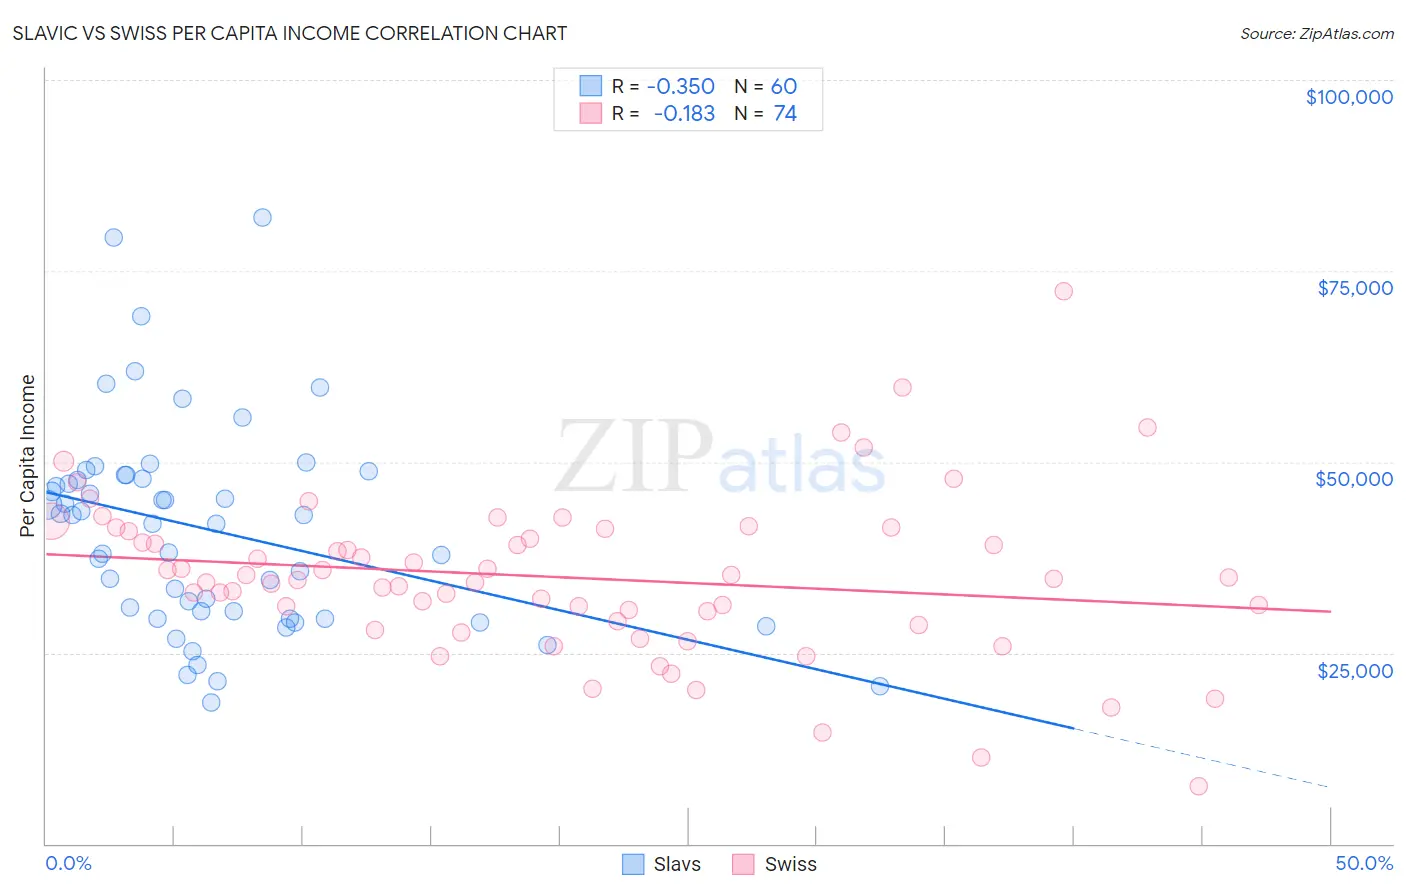
Slavic vs Swiss Per Capita Income Correlation Chart

The statistical analysis conducted on geographies consisting of 270,856,611 people shows a mild negative correlation between the proportion of Slavs and per capita income in the United States with a correlation coefficient (R) of -0.350 and weighted average of $45,049. Similarly, the statistical analysis conducted on geographies consisting of 465,046,505 people shows a poor negative correlation between the proportion of Swiss and per capita income in the United States with a correlation coefficient (R) of -0.183 and weighted average of $44,076, a difference of 2.2%.
Slavic vs Swiss Per Capita Income

Per Capita Income Correlation Summary

MeasurementSlavicSwiss
Minimum$18,507$7,533
Maximum$81,943$72,391
Range$63,436$64,858
Mean$41,079$34,911
Median$42,528$34,649
Interquartile 25% (IQ1)$30,000$29,057
Interquartile 75% (IQ3)$48,077$40,868
Interquartile Range (IQR)$18,077$11,811
Standard Deviation (Sample)$13,481$10,600
Standard Deviation (Population)$13,368$10,528

Similar Demographics by Per Capita Income

Demographics Similar to Slavs by Per Capita Income

In terms of per capita income, the demographic groups most similar to Slavs are Ugandan ($45,047, a difference of 0.0%), Immigrants from Uganda ($45,043, a difference of 0.010%), Immigrants from Jordan ($45,066, a difference of 0.040%), Basque ($45,086, a difference of 0.080%), and Icelander ($44,987, a difference of 0.14%).
DemographicsRating | RankPer Capita Income
Slovenes
89.6
/100
|
#134
Excellent
$45,581
Hungarians
87.9
/100
|
#135
Excellent
$45,426
Immigrants | Oceania
85.2
/100
|
#136
Excellent
$45,220
Immigrants | Syria
85.2
/100
|
#137
Excellent
$45,218
Assyrians/Chaldeans/Syriacs
84.8
/100
|
#138
Excellent
$45,195
Basques
83.2
/100
|
#139
Excellent
$45,086
Immigrants | Jordan
82.9
/100
|
#140
Excellent
$45,066
Slavs
82.6
/100
|
#141
Excellent
$45,049
Ugandans
82.6
/100
|
#142
Excellent
$45,047
Immigrants | Uganda
82.5
/100
|
#143
Excellent
$45,043
Icelanders
81.6
/100
|
#144
Excellent
$44,987
Immigrants | Afghanistan
78.0
/100
|
#145
Good
$44,790
Irish
75.8
/100
|
#146
Good
$44,679
Czechs
74.1
/100
|
#147
Good
$44,595
Immigrants | Armenia
73.1
/100
|
#148
Good
$44,552

Demographics Similar to Swiss by Per Capita Income

In terms of per capita income, the demographic groups most similar to Swiss are Immigrants from South America ($44,068, a difference of 0.020%), Costa Rican ($44,090, a difference of 0.030%), Danish ($44,095, a difference of 0.040%), South American ($44,114, a difference of 0.090%), and Sri Lankan ($44,014, a difference of 0.14%).
DemographicsRating | RankPer Capita Income
Uruguayans
67.6
/100
|
#155
Good
$44,318
Slovaks
65.4
/100
|
#156
Good
$44,229
South American Indians
64.8
/100
|
#157
Good
$44,206
Immigrants | Nepal
64.3
/100
|
#158
Good
$44,187
South Americans
62.4
/100
|
#159
Good
$44,114
Danes
61.9
/100
|
#160
Good
$44,095
Costa Ricans
61.8
/100
|
#161
Good
$44,090
Swiss
61.4
/100
|
#162
Good
$44,076
Immigrants | South America
61.2
/100
|
#163
Good
$44,068
Sri Lankans
59.8
/100
|
#164
Average
$44,014
Immigrants | Philippines
59.4
/100
|
#165
Average
$44,000
Immigrants | Uruguay
59.3
/100
|
#166
Average
$43,997
English
58.9
/100
|
#167
Average
$43,982
Belgians
58.1
/100
|
#168
Average
$43,951
Immigrants | Peru
55.3
/100
|
#169
Average
$43,852