Slavic vs Immigrants from Russia Per Capita Income
COMPARE
Slavic
Immigrants from Russia
Per Capita Income
Per Capita Income Comparison
Slavs
Immigrants from Russia
$45,049
PER CAPITA INCOME
82.6/ 100
METRIC RATING
141st/ 347
METRIC RANK
$52,044
PER CAPITA INCOME
100.0/ 100
METRIC RATING
34th/ 347
METRIC RANK
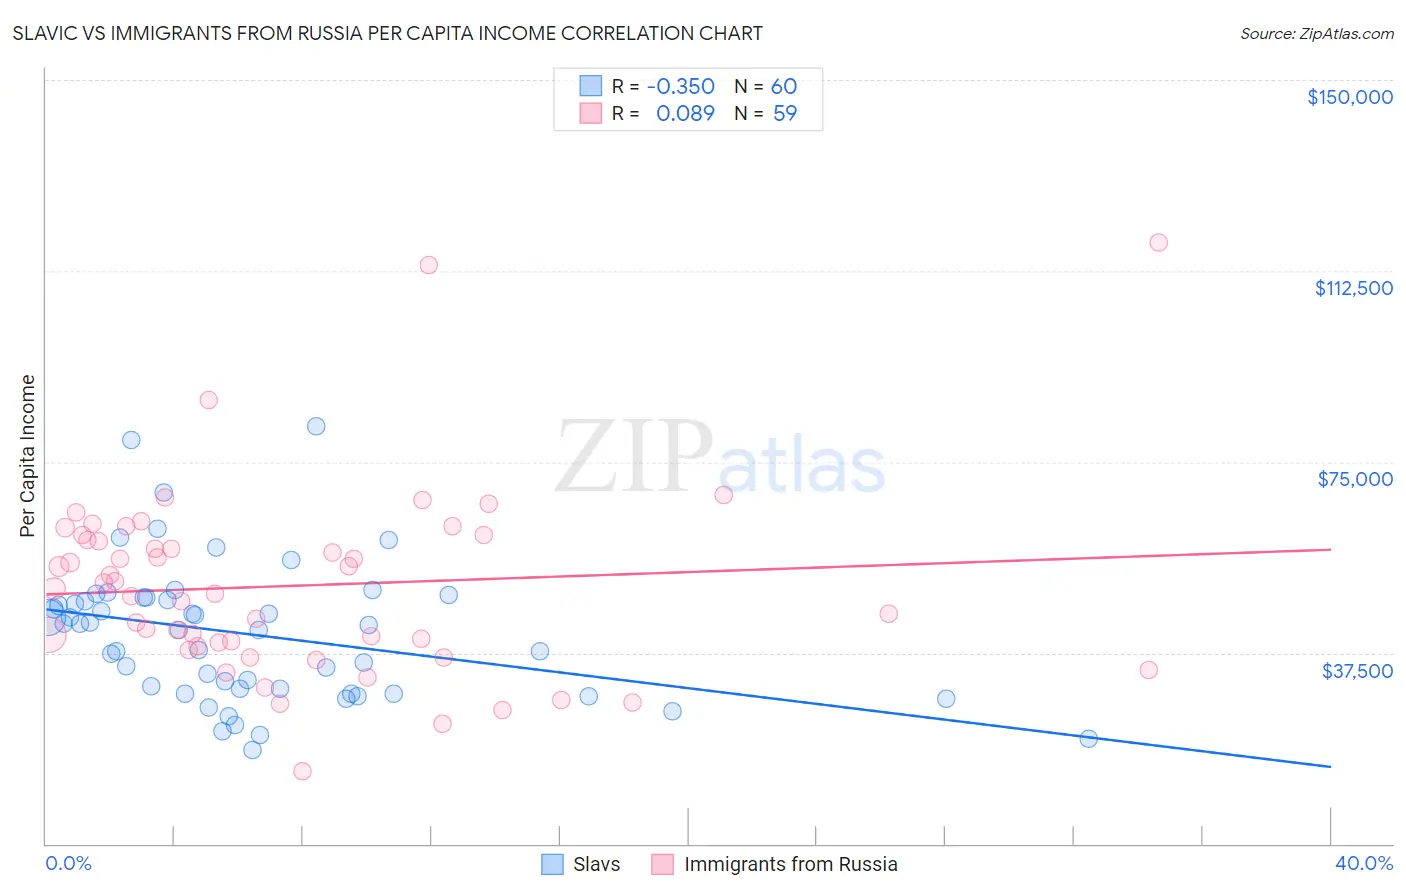
Slavic vs Immigrants from Russia Per Capita Income Correlation Chart
The statistical analysis conducted on geographies consisting of 270,856,611 people shows a mild negative correlation between the proportion of Slavs and per capita income in the United States with a correlation coefficient (R) of -0.350 and weighted average of $45,049. Similarly, the statistical analysis conducted on geographies consisting of 347,969,054 people shows a slight positive correlation between the proportion of Immigrants from Russia and per capita income in the United States with a correlation coefficient (R) of 0.089 and weighted average of $52,044, a difference of 15.5%.
Per Capita Income Correlation Summary
| Measurement | Slavic | Immigrants from Russia |
| Minimum | $18,507 | $14,227 |
| Maximum | $81,943 | $118,015 |
| Range | $63,436 | $103,788 |
| Mean | $41,079 | $50,649 |
| Median | $42,528 | $50,146 |
| Interquartile 25% (IQ1) | $30,000 | $38,836 |
| Interquartile 75% (IQ3) | $48,077 | $60,540 |
| Interquartile Range (IQR) | $18,077 | $21,704 |
| Standard Deviation (Sample) | $13,481 | $18,532 |
| Standard Deviation (Population) | $13,368 | $18,374 |
Similar Demographics by Per Capita Income
Demographics Similar to Slavs by Per Capita Income
In terms of per capita income, the demographic groups most similar to Slavs are Ugandan ($45,047, a difference of 0.0%), Immigrants from Uganda ($45,043, a difference of 0.010%), Immigrants from Jordan ($45,066, a difference of 0.040%), Basque ($45,086, a difference of 0.080%), and Icelander ($44,987, a difference of 0.14%).
| Demographics | Rating | Rank | Per Capita Income |
| Slovenes | 89.6 /100 | #134 | Excellent $45,581 |
| Hungarians | 87.9 /100 | #135 | Excellent $45,426 |
| Immigrants | Oceania | 85.2 /100 | #136 | Excellent $45,220 |
| Immigrants | Syria | 85.2 /100 | #137 | Excellent $45,218 |
| Assyrians/Chaldeans/Syriacs | 84.8 /100 | #138 | Excellent $45,195 |
| Basques | 83.2 /100 | #139 | Excellent $45,086 |
| Immigrants | Jordan | 82.9 /100 | #140 | Excellent $45,066 |
| Slavs | 82.6 /100 | #141 | Excellent $45,049 |
| Ugandans | 82.6 /100 | #142 | Excellent $45,047 |
| Immigrants | Uganda | 82.5 /100 | #143 | Excellent $45,043 |
| Icelanders | 81.6 /100 | #144 | Excellent $44,987 |
| Immigrants | Afghanistan | 78.0 /100 | #145 | Good $44,790 |
| Irish | 75.8 /100 | #146 | Good $44,679 |
| Czechs | 74.1 /100 | #147 | Good $44,595 |
| Immigrants | Armenia | 73.1 /100 | #148 | Good $44,552 |
Demographics Similar to Immigrants from Russia by Per Capita Income
In terms of per capita income, the demographic groups most similar to Immigrants from Russia are Australian ($52,074, a difference of 0.060%), Burmese ($52,005, a difference of 0.070%), Immigrants from Greece ($51,891, a difference of 0.29%), Immigrants from Norway ($52,217, a difference of 0.33%), and Estonian ($51,875, a difference of 0.33%).
| Demographics | Rating | Rank | Per Capita Income |
| Immigrants | South Central Asia | 100.0 /100 | #27 | Exceptional $52,660 |
| Latvians | 100.0 /100 | #28 | Exceptional $52,649 |
| Israelis | 100.0 /100 | #29 | Exceptional $52,596 |
| Immigrants | Austria | 100.0 /100 | #30 | Exceptional $52,503 |
| Turks | 100.0 /100 | #31 | Exceptional $52,391 |
| Immigrants | Norway | 100.0 /100 | #32 | Exceptional $52,217 |
| Australians | 100.0 /100 | #33 | Exceptional $52,074 |
| Immigrants | Russia | 100.0 /100 | #34 | Exceptional $52,044 |
| Burmese | 100.0 /100 | #35 | Exceptional $52,005 |
| Immigrants | Greece | 100.0 /100 | #36 | Exceptional $51,891 |
| Estonians | 100.0 /100 | #37 | Exceptional $51,875 |
| Immigrants | Czechoslovakia | 100.0 /100 | #38 | Exceptional $51,770 |
| Cambodians | 100.0 /100 | #39 | Exceptional $51,731 |
| Immigrants | Korea | 100.0 /100 | #40 | Exceptional $51,671 |
| Immigrants | South Africa | 100.0 /100 | #41 | Exceptional $51,465 |