Bahamian vs Immigrants from Micronesia Per Capita Income
COMPARE
Bahamian
Immigrants from Micronesia
Per Capita Income
Per Capita Income Comparison
Bahamians
Immigrants from Micronesia
$36,427
PER CAPITA INCOME
0.0/ 100
METRIC RATING
313th/ 347
METRIC RANK
$37,464
PER CAPITA INCOME
0.1/ 100
METRIC RATING
292nd/ 347
METRIC RANK
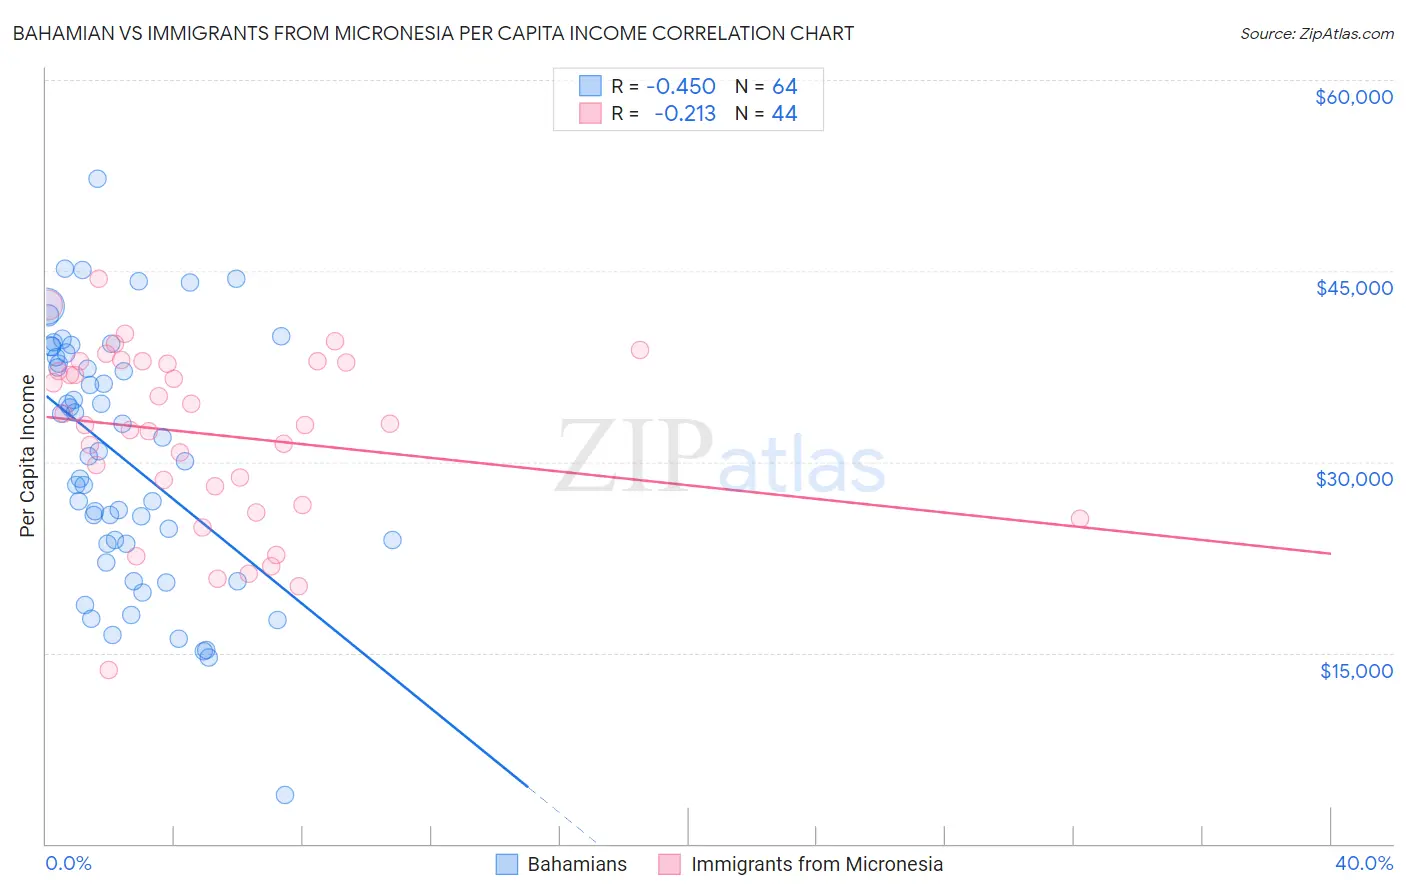
Bahamian vs Immigrants from Micronesia Per Capita Income Correlation Chart
The statistical analysis conducted on geographies consisting of 112,707,980 people shows a moderate negative correlation between the proportion of Bahamians and per capita income in the United States with a correlation coefficient (R) of -0.450 and weighted average of $36,427. Similarly, the statistical analysis conducted on geographies consisting of 61,609,499 people shows a weak negative correlation between the proportion of Immigrants from Micronesia and per capita income in the United States with a correlation coefficient (R) of -0.213 and weighted average of $37,464, a difference of 2.9%.
Per Capita Income Correlation Summary
| Measurement | Bahamian | Immigrants from Micronesia |
| Minimum | $3,864 | $13,631 |
| Maximum | $52,210 | $44,421 |
| Range | $48,346 | $30,790 |
| Mean | $30,310 | $32,171 |
| Median | $30,639 | $32,971 |
| Interquartile 25% (IQ1) | $23,571 | $27,332 |
| Interquartile 75% (IQ3) | $38,367 | $37,862 |
| Interquartile Range (IQR) | $14,797 | $10,531 |
| Standard Deviation (Sample) | $9,801 | $6,923 |
| Standard Deviation (Population) | $9,724 | $6,844 |
Similar Demographics by Per Capita Income
Demographics Similar to Bahamians by Per Capita Income
In terms of per capita income, the demographic groups most similar to Bahamians are Chickasaw ($36,475, a difference of 0.13%), Chippewa ($36,631, a difference of 0.56%), Ute ($36,651, a difference of 0.62%), Immigrants from Honduras ($36,665, a difference of 0.65%), and Seminole ($36,180, a difference of 0.68%).
| Demographics | Rating | Rank | Per Capita Income |
| Immigrants | Haiti | 0.0 /100 | #306 | Tragic $36,849 |
| Immigrants | Latin America | 0.0 /100 | #307 | Tragic $36,823 |
| Fijians | 0.0 /100 | #308 | Tragic $36,690 |
| Immigrants | Honduras | 0.0 /100 | #309 | Tragic $36,665 |
| Ute | 0.0 /100 | #310 | Tragic $36,651 |
| Chippewa | 0.0 /100 | #311 | Tragic $36,631 |
| Chickasaw | 0.0 /100 | #312 | Tragic $36,475 |
| Bahamians | 0.0 /100 | #313 | Tragic $36,427 |
| Seminole | 0.0 /100 | #314 | Tragic $36,180 |
| Yaqui | 0.0 /100 | #315 | Tragic $36,112 |
| Choctaw | 0.0 /100 | #316 | Tragic $35,999 |
| Dutch West Indians | 0.0 /100 | #317 | Tragic $35,922 |
| Bangladeshis | 0.0 /100 | #318 | Tragic $35,897 |
| Immigrants | Congo | 0.0 /100 | #319 | Tragic $35,720 |
| Hispanics or Latinos | 0.0 /100 | #320 | Tragic $35,688 |
Demographics Similar to Immigrants from Micronesia by Per Capita Income
In terms of per capita income, the demographic groups most similar to Immigrants from Micronesia are Mexican American Indian ($37,407, a difference of 0.15%), Cajun ($37,527, a difference of 0.17%), Cuban ($37,383, a difference of 0.22%), Immigrants from Guatemala ($37,550, a difference of 0.23%), and U.S. Virgin Islander ($37,589, a difference of 0.33%).
| Demographics | Rating | Rank | Per Capita Income |
| Guatemalans | 0.1 /100 | #285 | Tragic $37,766 |
| Central American Indians | 0.1 /100 | #286 | Tragic $37,699 |
| Dominicans | 0.1 /100 | #287 | Tragic $37,697 |
| Blackfeet | 0.1 /100 | #288 | Tragic $37,695 |
| U.S. Virgin Islanders | 0.1 /100 | #289 | Tragic $37,589 |
| Immigrants | Guatemala | 0.1 /100 | #290 | Tragic $37,550 |
| Cajuns | 0.1 /100 | #291 | Tragic $37,527 |
| Immigrants | Micronesia | 0.1 /100 | #292 | Tragic $37,464 |
| Mexican American Indians | 0.1 /100 | #293 | Tragic $37,407 |
| Cubans | 0.1 /100 | #294 | Tragic $37,383 |
| Immigrants | Dominican Republic | 0.1 /100 | #295 | Tragic $37,306 |
| Indonesians | 0.1 /100 | #296 | Tragic $37,300 |
| Haitians | 0.1 /100 | #297 | Tragic $37,289 |
| Immigrants | Caribbean | 0.1 /100 | #298 | Tragic $37,254 |
| Cherokee | 0.1 /100 | #299 | Tragic $37,203 |