Senegalese vs Immigrants from Micronesia Per Capita Income
COMPARE
Senegalese
Immigrants from Micronesia
Per Capita Income
Per Capita Income Comparison
Senegalese
Immigrants from Micronesia
$41,000
PER CAPITA INCOME
4.8/ 100
METRIC RATING
231st/ 347
METRIC RANK
$37,464
PER CAPITA INCOME
0.1/ 100
METRIC RATING
292nd/ 347
METRIC RANK
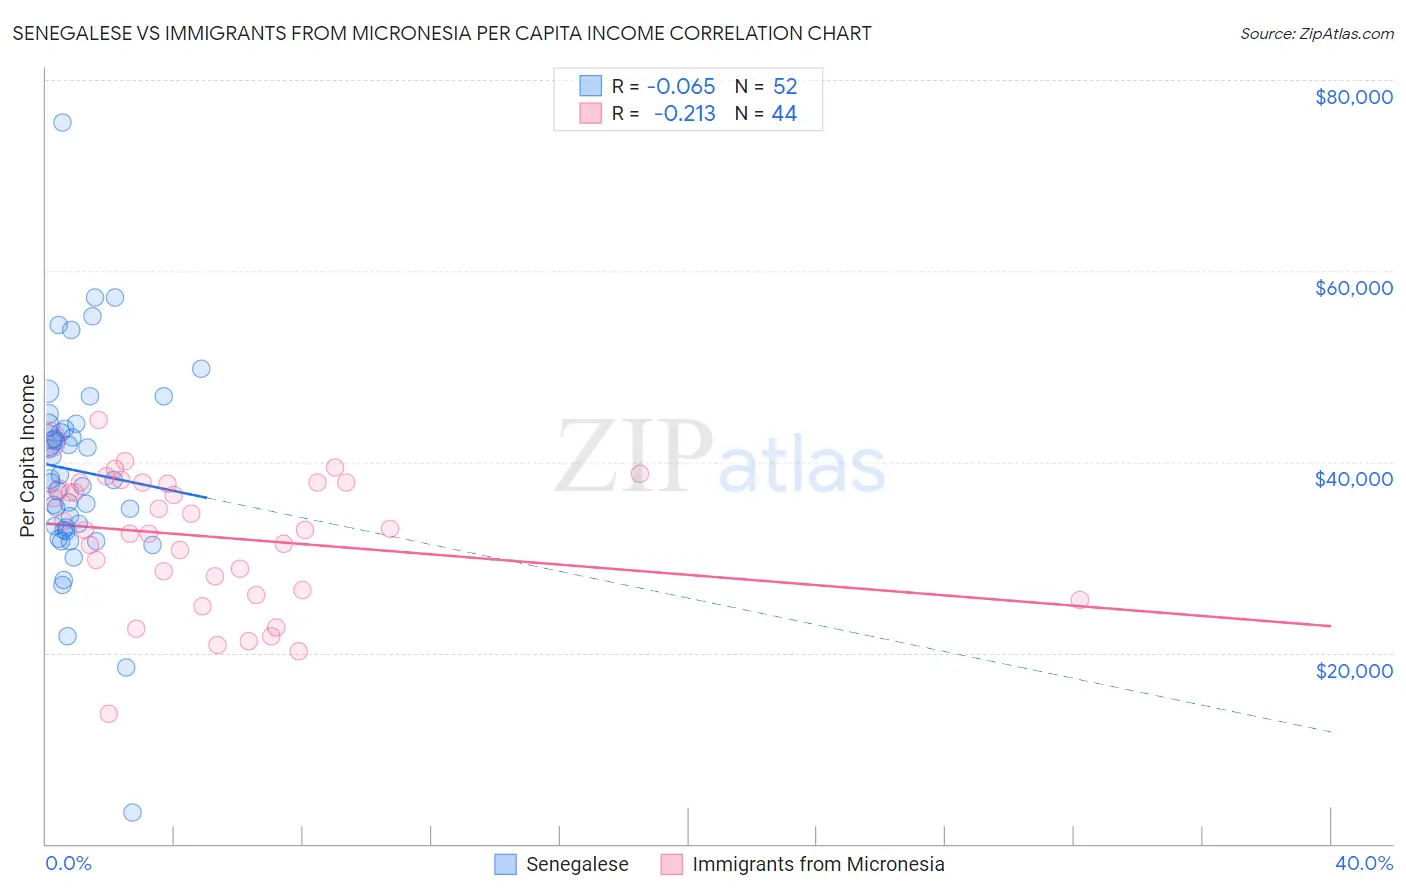
Senegalese vs Immigrants from Micronesia Per Capita Income Correlation Chart
The statistical analysis conducted on geographies consisting of 78,107,792 people shows a slight negative correlation between the proportion of Senegalese and per capita income in the United States with a correlation coefficient (R) of -0.065 and weighted average of $41,000. Similarly, the statistical analysis conducted on geographies consisting of 61,609,499 people shows a weak negative correlation between the proportion of Immigrants from Micronesia and per capita income in the United States with a correlation coefficient (R) of -0.213 and weighted average of $37,464, a difference of 9.4%.
Per Capita Income Correlation Summary
| Measurement | Senegalese | Immigrants from Micronesia |
| Minimum | $3,219 | $13,631 |
| Maximum | $75,539 | $44,421 |
| Range | $72,320 | $30,790 |
| Mean | $39,064 | $32,171 |
| Median | $38,147 | $32,971 |
| Interquartile 25% (IQ1) | $33,014 | $27,332 |
| Interquartile 75% (IQ3) | $43,632 | $37,862 |
| Interquartile Range (IQR) | $10,618 | $10,531 |
| Standard Deviation (Sample) | $10,948 | $6,923 |
| Standard Deviation (Population) | $10,843 | $6,844 |
Similar Demographics by Per Capita Income
Demographics Similar to Senegalese by Per Capita Income
In terms of per capita income, the demographic groups most similar to Senegalese are Native Hawaiian ($41,017, a difference of 0.040%), Nigerian ($41,026, a difference of 0.060%), Guyanese ($40,949, a difference of 0.12%), Immigrants from Grenada ($41,123, a difference of 0.30%), and Immigrants from Ghana ($41,131, a difference of 0.32%).
| Demographics | Rating | Rank | Per Capita Income |
| Immigrants | St. Vincent and the Grenadines | 6.4 /100 | #224 | Tragic $41,270 |
| West Indians | 6.0 /100 | #225 | Tragic $41,217 |
| Immigrants | Ecuador | 5.9 /100 | #226 | Tragic $41,195 |
| Immigrants | Ghana | 5.5 /100 | #227 | Tragic $41,131 |
| Immigrants | Grenada | 5.5 /100 | #228 | Tragic $41,123 |
| Nigerians | 4.9 /100 | #229 | Tragic $41,026 |
| Native Hawaiians | 4.9 /100 | #230 | Tragic $41,017 |
| Senegalese | 4.8 /100 | #231 | Tragic $41,000 |
| Guyanese | 4.5 /100 | #232 | Tragic $40,949 |
| Delaware | 3.8 /100 | #233 | Tragic $40,778 |
| Immigrants | West Indies | 3.7 /100 | #234 | Tragic $40,763 |
| Immigrants | Guyana | 3.6 /100 | #235 | Tragic $40,742 |
| Immigrants | Nonimmigrants | 3.4 /100 | #236 | Tragic $40,669 |
| Immigrants | Cambodia | 2.6 /100 | #237 | Tragic $40,434 |
| Somalis | 2.4 /100 | #238 | Tragic $40,367 |
Demographics Similar to Immigrants from Micronesia by Per Capita Income
In terms of per capita income, the demographic groups most similar to Immigrants from Micronesia are Mexican American Indian ($37,407, a difference of 0.15%), Cajun ($37,527, a difference of 0.17%), Cuban ($37,383, a difference of 0.22%), Immigrants from Guatemala ($37,550, a difference of 0.23%), and U.S. Virgin Islander ($37,589, a difference of 0.33%).
| Demographics | Rating | Rank | Per Capita Income |
| Guatemalans | 0.1 /100 | #285 | Tragic $37,766 |
| Central American Indians | 0.1 /100 | #286 | Tragic $37,699 |
| Dominicans | 0.1 /100 | #287 | Tragic $37,697 |
| Blackfeet | 0.1 /100 | #288 | Tragic $37,695 |
| U.S. Virgin Islanders | 0.1 /100 | #289 | Tragic $37,589 |
| Immigrants | Guatemala | 0.1 /100 | #290 | Tragic $37,550 |
| Cajuns | 0.1 /100 | #291 | Tragic $37,527 |
| Immigrants | Micronesia | 0.1 /100 | #292 | Tragic $37,464 |
| Mexican American Indians | 0.1 /100 | #293 | Tragic $37,407 |
| Cubans | 0.1 /100 | #294 | Tragic $37,383 |
| Immigrants | Dominican Republic | 0.1 /100 | #295 | Tragic $37,306 |
| Indonesians | 0.1 /100 | #296 | Tragic $37,300 |
| Haitians | 0.1 /100 | #297 | Tragic $37,289 |
| Immigrants | Caribbean | 0.1 /100 | #298 | Tragic $37,254 |
| Cherokee | 0.1 /100 | #299 | Tragic $37,203 |