Slavic vs Immigrants from Micronesia Child Poverty Among Boys Under 16
COMPARE
Slavic
Immigrants from Micronesia
Child Poverty Among Boys Under 16
Child Poverty Among Boys Under 16 Comparison
Slavs
Immigrants from Micronesia
15.7%
CHILD POVERTY AMONG BOYS UNDER 16
84.5/ 100
METRIC RATING
141st/ 347
METRIC RANK
18.3%
CHILD POVERTY AMONG BOYS UNDER 16
1.8/ 100
METRIC RATING
229th/ 347
METRIC RANK
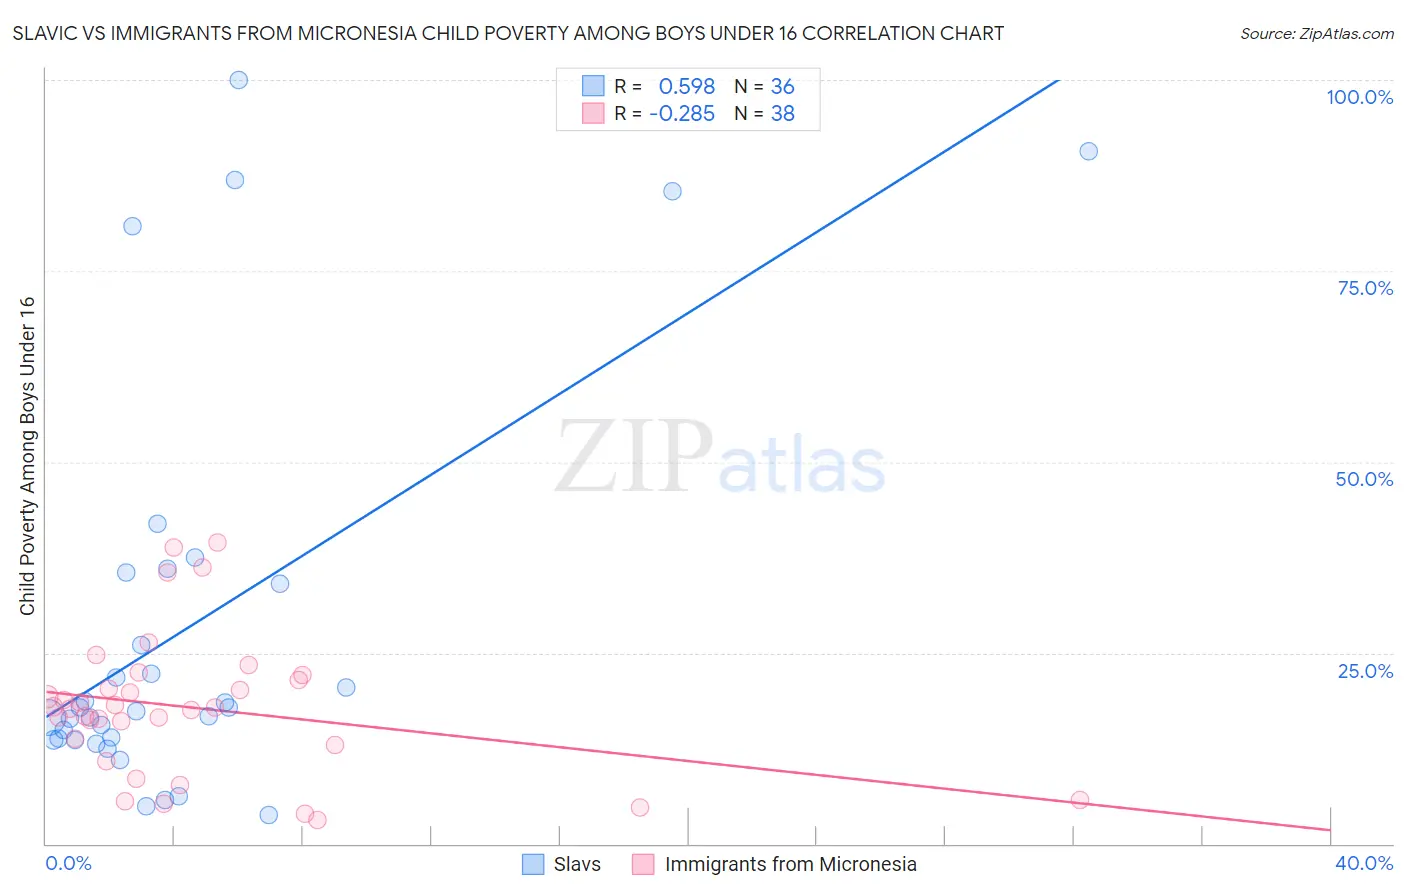
Slavic vs Immigrants from Micronesia Child Poverty Among Boys Under 16 Correlation Chart
The statistical analysis conducted on geographies consisting of 267,135,451 people shows a substantial positive correlation between the proportion of Slavs and poverty level among boys under the age of 16 in the United States with a correlation coefficient (R) of 0.598 and weighted average of 15.7%. Similarly, the statistical analysis conducted on geographies consisting of 61,480,670 people shows a weak negative correlation between the proportion of Immigrants from Micronesia and poverty level among boys under the age of 16 in the United States with a correlation coefficient (R) of -0.285 and weighted average of 18.3%, a difference of 16.7%.
Child Poverty Among Boys Under 16 Correlation Summary
| Measurement | Slavic | Immigrants from Micronesia |
| Minimum | 3.7% | 3.0% |
| Maximum | 100.0% | 39.5% |
| Range | 96.3% | 36.4% |
| Mean | 28.3% | 17.8% |
| Median | 17.6% | 17.8% |
| Interquartile 25% (IQ1) | 13.7% | 12.9% |
| Interquartile 75% (IQ3) | 34.8% | 21.5% |
| Interquartile Range (IQR) | 21.1% | 8.6% |
| Standard Deviation (Sample) | 26.3% | 9.2% |
| Standard Deviation (Population) | 26.0% | 9.1% |
Similar Demographics by Child Poverty Among Boys Under 16
Demographics Similar to Slavs by Child Poverty Among Boys Under 16
In terms of child poverty among boys under 16, the demographic groups most similar to Slavs are Immigrants from Hungary (15.7%, a difference of 0.090%), Immigrants from Fiji (15.7%, a difference of 0.19%), Immigrants from Peru (15.7%, a difference of 0.22%), Immigrants from Kuwait (15.6%, a difference of 0.26%), and Samoan (15.7%, a difference of 0.27%).
| Demographics | Rating | Rank | Child Poverty Among Boys Under 16 |
| Peruvians | 88.1 /100 | #134 | Excellent 15.5% |
| Portuguese | 87.5 /100 | #135 | Excellent 15.5% |
| Icelanders | 87.5 /100 | #136 | Excellent 15.5% |
| Immigrants | Spain | 87.1 /100 | #137 | Excellent 15.6% |
| Immigrants | Southern Europe | 86.5 /100 | #138 | Excellent 15.6% |
| Albanians | 86.5 /100 | #139 | Excellent 15.6% |
| Immigrants | Kuwait | 85.6 /100 | #140 | Excellent 15.6% |
| Slavs | 84.5 /100 | #141 | Excellent 15.7% |
| Immigrants | Hungary | 84.1 /100 | #142 | Excellent 15.7% |
| Immigrants | Fiji | 83.6 /100 | #143 | Excellent 15.7% |
| Immigrants | Peru | 83.5 /100 | #144 | Excellent 15.7% |
| Samoans | 83.2 /100 | #145 | Excellent 15.7% |
| New Zealanders | 82.4 /100 | #146 | Excellent 15.7% |
| Venezuelans | 82.1 /100 | #147 | Excellent 15.7% |
| Brazilians | 81.0 /100 | #148 | Excellent 15.8% |
Demographics Similar to Immigrants from Micronesia by Child Poverty Among Boys Under 16
In terms of child poverty among boys under 16, the demographic groups most similar to Immigrants from Micronesia are Fijian (18.3%, a difference of 0.0%), Nonimmigrants (18.2%, a difference of 0.52%), Nicaraguan (18.4%, a difference of 0.53%), Marshallese (18.4%, a difference of 0.73%), and Bermudan (18.1%, a difference of 0.85%).
| Demographics | Rating | Rank | Child Poverty Among Boys Under 16 |
| Pennsylvania Germans | 3.9 /100 | #222 | Tragic 17.9% |
| Cubans | 3.8 /100 | #223 | Tragic 17.9% |
| Nepalese | 3.2 /100 | #224 | Tragic 18.0% |
| Inupiat | 2.7 /100 | #225 | Tragic 18.1% |
| Immigrants | Africa | 2.6 /100 | #226 | Tragic 18.1% |
| Bermudans | 2.5 /100 | #227 | Tragic 18.1% |
| Immigrants | Nonimmigrants | 2.2 /100 | #228 | Tragic 18.2% |
| Immigrants | Micronesia | 1.8 /100 | #229 | Tragic 18.3% |
| Fijians | 1.8 /100 | #230 | Tragic 18.3% |
| Nicaraguans | 1.4 /100 | #231 | Tragic 18.4% |
| Marshallese | 1.3 /100 | #232 | Tragic 18.4% |
| Immigrants | Nigeria | 1.2 /100 | #233 | Tragic 18.4% |
| Nigerians | 1.1 /100 | #234 | Tragic 18.5% |
| Americans | 0.9 /100 | #235 | Tragic 18.6% |
| Sudanese | 0.9 /100 | #236 | Tragic 18.6% |