Ute vs Immigrants from Micronesia Per Capita Income
COMPARE
Ute
Immigrants from Micronesia
Per Capita Income
Per Capita Income Comparison
Ute
Immigrants from Micronesia
$36,651
PER CAPITA INCOME
0.0/ 100
METRIC RATING
310th/ 347
METRIC RANK
$37,464
PER CAPITA INCOME
0.1/ 100
METRIC RATING
292nd/ 347
METRIC RANK
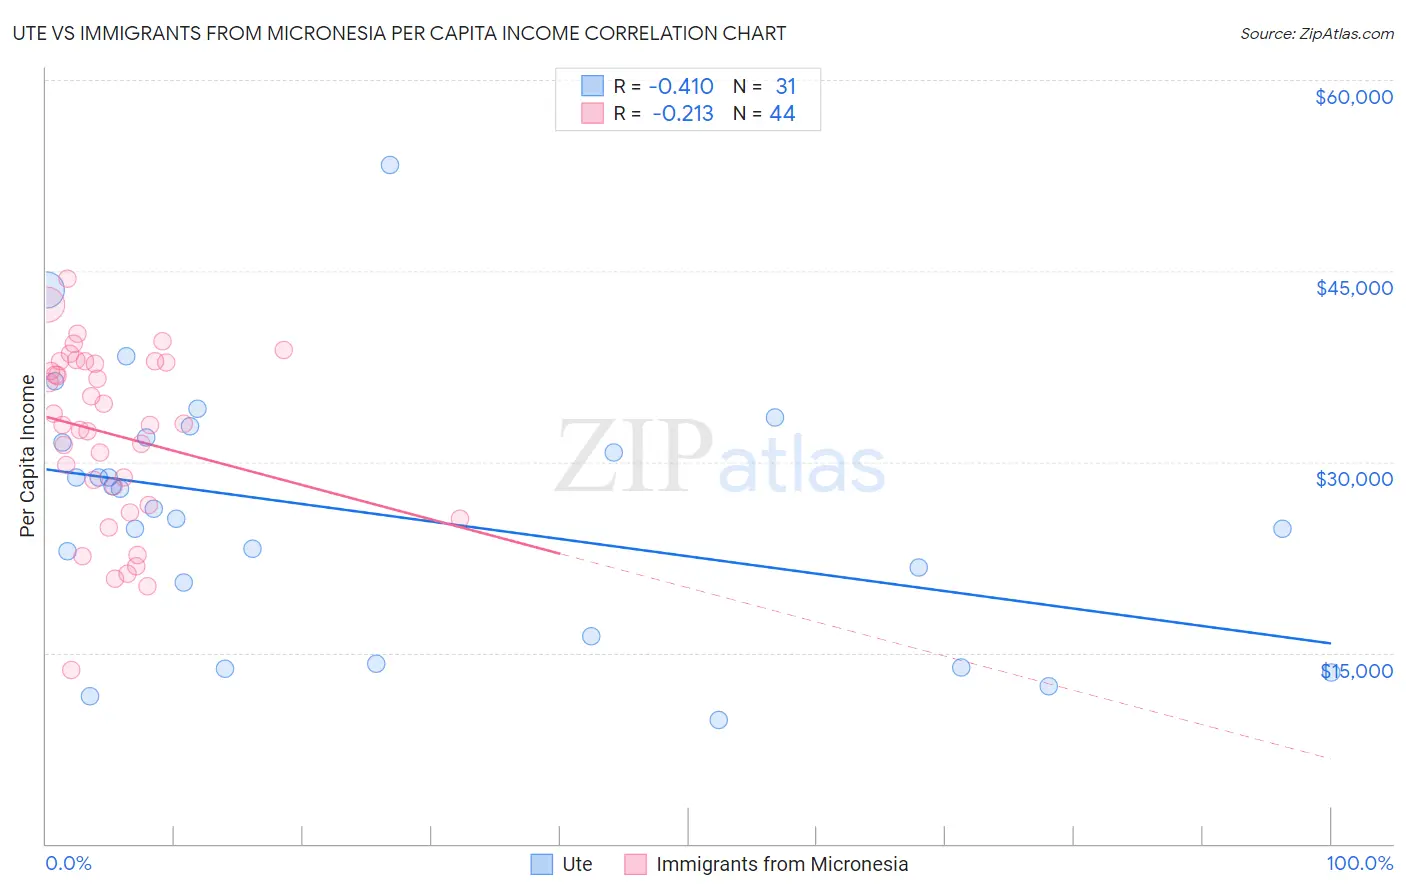
Ute vs Immigrants from Micronesia Per Capita Income Correlation Chart
The statistical analysis conducted on geographies consisting of 55,660,141 people shows a moderate negative correlation between the proportion of Ute and per capita income in the United States with a correlation coefficient (R) of -0.410 and weighted average of $36,651. Similarly, the statistical analysis conducted on geographies consisting of 61,609,499 people shows a weak negative correlation between the proportion of Immigrants from Micronesia and per capita income in the United States with a correlation coefficient (R) of -0.213 and weighted average of $37,464, a difference of 2.2%.
Per Capita Income Correlation Summary
| Measurement | Ute | Immigrants from Micronesia |
| Minimum | $9,749 | $13,631 |
| Maximum | $53,279 | $44,421 |
| Range | $43,530 | $30,790 |
| Mean | $25,907 | $32,171 |
| Median | $26,299 | $32,971 |
| Interquartile 25% (IQ1) | $16,307 | $27,332 |
| Interquartile 75% (IQ3) | $31,910 | $37,862 |
| Interquartile Range (IQR) | $15,603 | $10,531 |
| Standard Deviation (Sample) | $10,024 | $6,923 |
| Standard Deviation (Population) | $9,861 | $6,844 |
Demographics Similar to Ute and Immigrants from Micronesia by Per Capita Income
In terms of per capita income, the demographic groups most similar to Ute are Immigrants from Honduras ($36,665, a difference of 0.040%), Chippewa ($36,631, a difference of 0.060%), Fijian ($36,690, a difference of 0.10%), Immigrants from Latin America ($36,823, a difference of 0.47%), and Immigrants from Haiti ($36,849, a difference of 0.54%). Similarly, the demographic groups most similar to Immigrants from Micronesia are Mexican American Indian ($37,407, a difference of 0.15%), Cajun ($37,527, a difference of 0.17%), Cuban ($37,383, a difference of 0.22%), Immigrants from Dominican Republic ($37,306, a difference of 0.42%), and Indonesian ($37,300, a difference of 0.44%).
| Demographics | Rating | Rank | Per Capita Income |
| Cajuns | 0.1 /100 | #291 | Tragic $37,527 |
| Immigrants | Micronesia | 0.1 /100 | #292 | Tragic $37,464 |
| Mexican American Indians | 0.1 /100 | #293 | Tragic $37,407 |
| Cubans | 0.1 /100 | #294 | Tragic $37,383 |
| Immigrants | Dominican Republic | 0.1 /100 | #295 | Tragic $37,306 |
| Indonesians | 0.1 /100 | #296 | Tragic $37,300 |
| Haitians | 0.1 /100 | #297 | Tragic $37,289 |
| Immigrants | Caribbean | 0.1 /100 | #298 | Tragic $37,254 |
| Cherokee | 0.1 /100 | #299 | Tragic $37,203 |
| Immigrants | Bahamas | 0.1 /100 | #300 | Tragic $37,193 |
| Ottawa | 0.1 /100 | #301 | Tragic $37,101 |
| Shoshone | 0.1 /100 | #302 | Tragic $37,072 |
| Paiute | 0.1 /100 | #303 | Tragic $37,066 |
| Hondurans | 0.1 /100 | #304 | Tragic $37,031 |
| Inupiat | 0.1 /100 | #305 | Tragic $36,999 |
| Immigrants | Haiti | 0.0 /100 | #306 | Tragic $36,849 |
| Immigrants | Latin America | 0.0 /100 | #307 | Tragic $36,823 |
| Fijians | 0.0 /100 | #308 | Tragic $36,690 |
| Immigrants | Honduras | 0.0 /100 | #309 | Tragic $36,665 |
| Ute | 0.0 /100 | #310 | Tragic $36,651 |
| Chippewa | 0.0 /100 | #311 | Tragic $36,631 |