Sri Lankan vs Immigrants from Micronesia Per Capita Income
COMPARE
Sri Lankan
Immigrants from Micronesia
Per Capita Income
Per Capita Income Comparison
Sri Lankans
Immigrants from Micronesia
$44,014
PER CAPITA INCOME
59.8/ 100
METRIC RATING
164th/ 347
METRIC RANK
$37,464
PER CAPITA INCOME
0.1/ 100
METRIC RATING
292nd/ 347
METRIC RANK
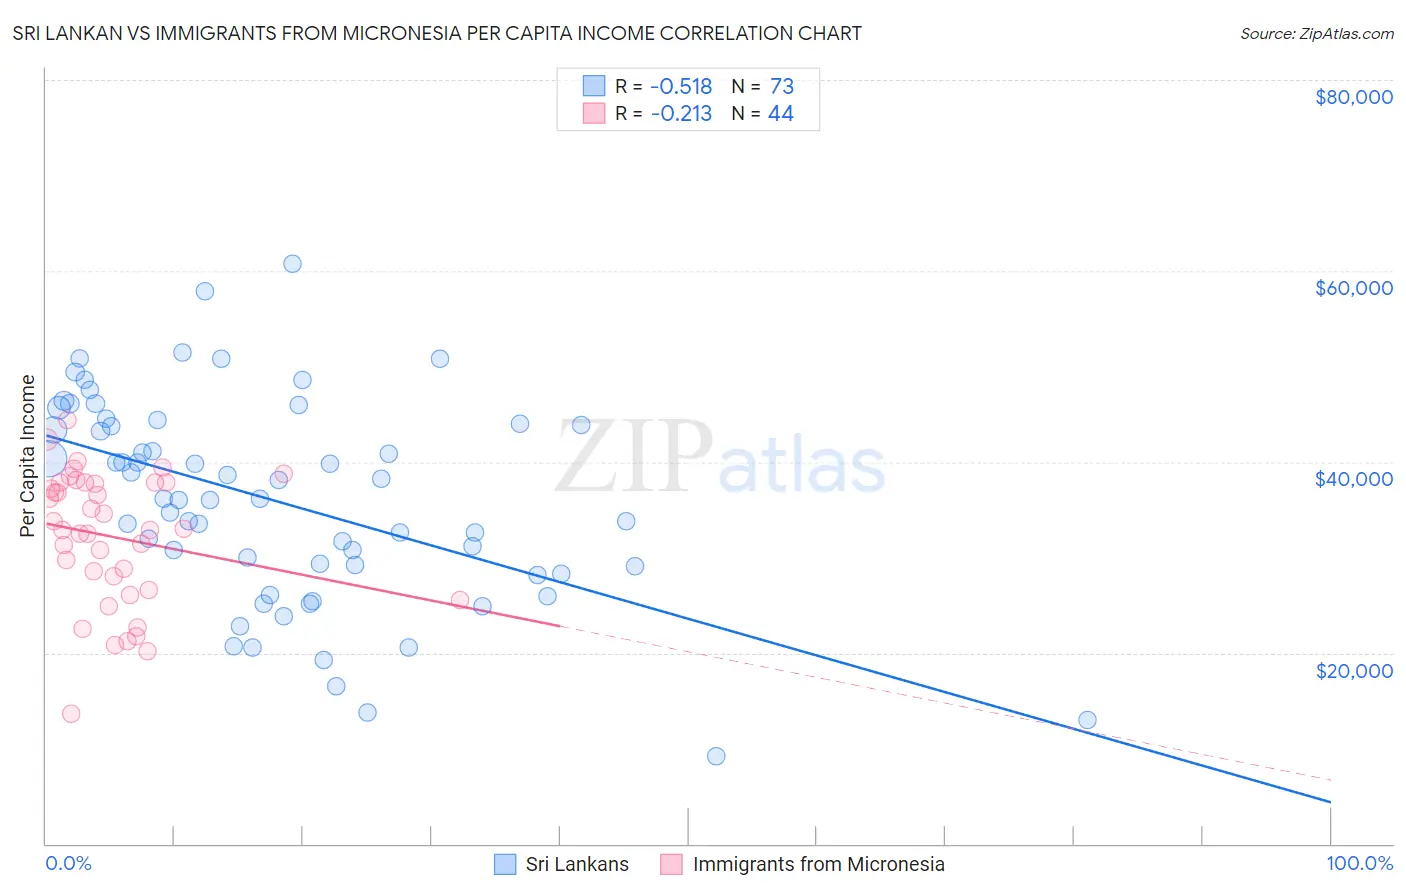
Sri Lankan vs Immigrants from Micronesia Per Capita Income Correlation Chart
The statistical analysis conducted on geographies consisting of 440,642,250 people shows a substantial negative correlation between the proportion of Sri Lankans and per capita income in the United States with a correlation coefficient (R) of -0.518 and weighted average of $44,014. Similarly, the statistical analysis conducted on geographies consisting of 61,609,499 people shows a weak negative correlation between the proportion of Immigrants from Micronesia and per capita income in the United States with a correlation coefficient (R) of -0.213 and weighted average of $37,464, a difference of 17.5%.
Per Capita Income Correlation Summary
| Measurement | Sri Lankan | Immigrants from Micronesia |
| Minimum | $9,224 | $13,631 |
| Maximum | $60,722 | $44,421 |
| Range | $51,498 | $30,790 |
| Mean | $35,781 | $32,171 |
| Median | $36,115 | $32,971 |
| Interquartile 25% (IQ1) | $28,668 | $27,332 |
| Interquartile 75% (IQ3) | $43,934 | $37,862 |
| Interquartile Range (IQR) | $15,265 | $10,531 |
| Standard Deviation (Sample) | $10,742 | $6,923 |
| Standard Deviation (Population) | $10,669 | $6,844 |
Similar Demographics by Per Capita Income
Demographics Similar to Sri Lankans by Per Capita Income
In terms of per capita income, the demographic groups most similar to Sri Lankans are Immigrants from Philippines ($44,000, a difference of 0.030%), Immigrants from Uruguay ($43,997, a difference of 0.040%), English ($43,982, a difference of 0.070%), Immigrants from South America ($44,068, a difference of 0.12%), and Swiss ($44,076, a difference of 0.14%).
| Demographics | Rating | Rank | Per Capita Income |
| South American Indians | 64.8 /100 | #157 | Good $44,206 |
| Immigrants | Nepal | 64.3 /100 | #158 | Good $44,187 |
| South Americans | 62.4 /100 | #159 | Good $44,114 |
| Danes | 61.9 /100 | #160 | Good $44,095 |
| Costa Ricans | 61.8 /100 | #161 | Good $44,090 |
| Swiss | 61.4 /100 | #162 | Good $44,076 |
| Immigrants | South America | 61.2 /100 | #163 | Good $44,068 |
| Sri Lankans | 59.8 /100 | #164 | Average $44,014 |
| Immigrants | Philippines | 59.4 /100 | #165 | Average $44,000 |
| Immigrants | Uruguay | 59.3 /100 | #166 | Average $43,997 |
| English | 58.9 /100 | #167 | Average $43,982 |
| Belgians | 58.1 /100 | #168 | Average $43,951 |
| Immigrants | Peru | 55.3 /100 | #169 | Average $43,852 |
| Scandinavians | 55.2 /100 | #170 | Average $43,848 |
| Immigrants | Eastern Africa | 54.9 /100 | #171 | Average $43,838 |
Demographics Similar to Immigrants from Micronesia by Per Capita Income
In terms of per capita income, the demographic groups most similar to Immigrants from Micronesia are Mexican American Indian ($37,407, a difference of 0.15%), Cajun ($37,527, a difference of 0.17%), Cuban ($37,383, a difference of 0.22%), Immigrants from Guatemala ($37,550, a difference of 0.23%), and U.S. Virgin Islander ($37,589, a difference of 0.33%).
| Demographics | Rating | Rank | Per Capita Income |
| Guatemalans | 0.1 /100 | #285 | Tragic $37,766 |
| Central American Indians | 0.1 /100 | #286 | Tragic $37,699 |
| Dominicans | 0.1 /100 | #287 | Tragic $37,697 |
| Blackfeet | 0.1 /100 | #288 | Tragic $37,695 |
| U.S. Virgin Islanders | 0.1 /100 | #289 | Tragic $37,589 |
| Immigrants | Guatemala | 0.1 /100 | #290 | Tragic $37,550 |
| Cajuns | 0.1 /100 | #291 | Tragic $37,527 |
| Immigrants | Micronesia | 0.1 /100 | #292 | Tragic $37,464 |
| Mexican American Indians | 0.1 /100 | #293 | Tragic $37,407 |
| Cubans | 0.1 /100 | #294 | Tragic $37,383 |
| Immigrants | Dominican Republic | 0.1 /100 | #295 | Tragic $37,306 |
| Indonesians | 0.1 /100 | #296 | Tragic $37,300 |
| Haitians | 0.1 /100 | #297 | Tragic $37,289 |
| Immigrants | Caribbean | 0.1 /100 | #298 | Tragic $37,254 |
| Cherokee | 0.1 /100 | #299 | Tragic $37,203 |