Slavic vs Indian (Asian) Per Capita Income
COMPARE
Slavic
Indian (Asian)
Per Capita Income
Per Capita Income Comparison
Slavs
Indians (Asian)
$45,049
PER CAPITA INCOME
82.6/ 100
METRIC RATING
141st/ 347
METRIC RANK
$53,874
PER CAPITA INCOME
100.0/ 100
METRIC RATING
22nd/ 347
METRIC RANK
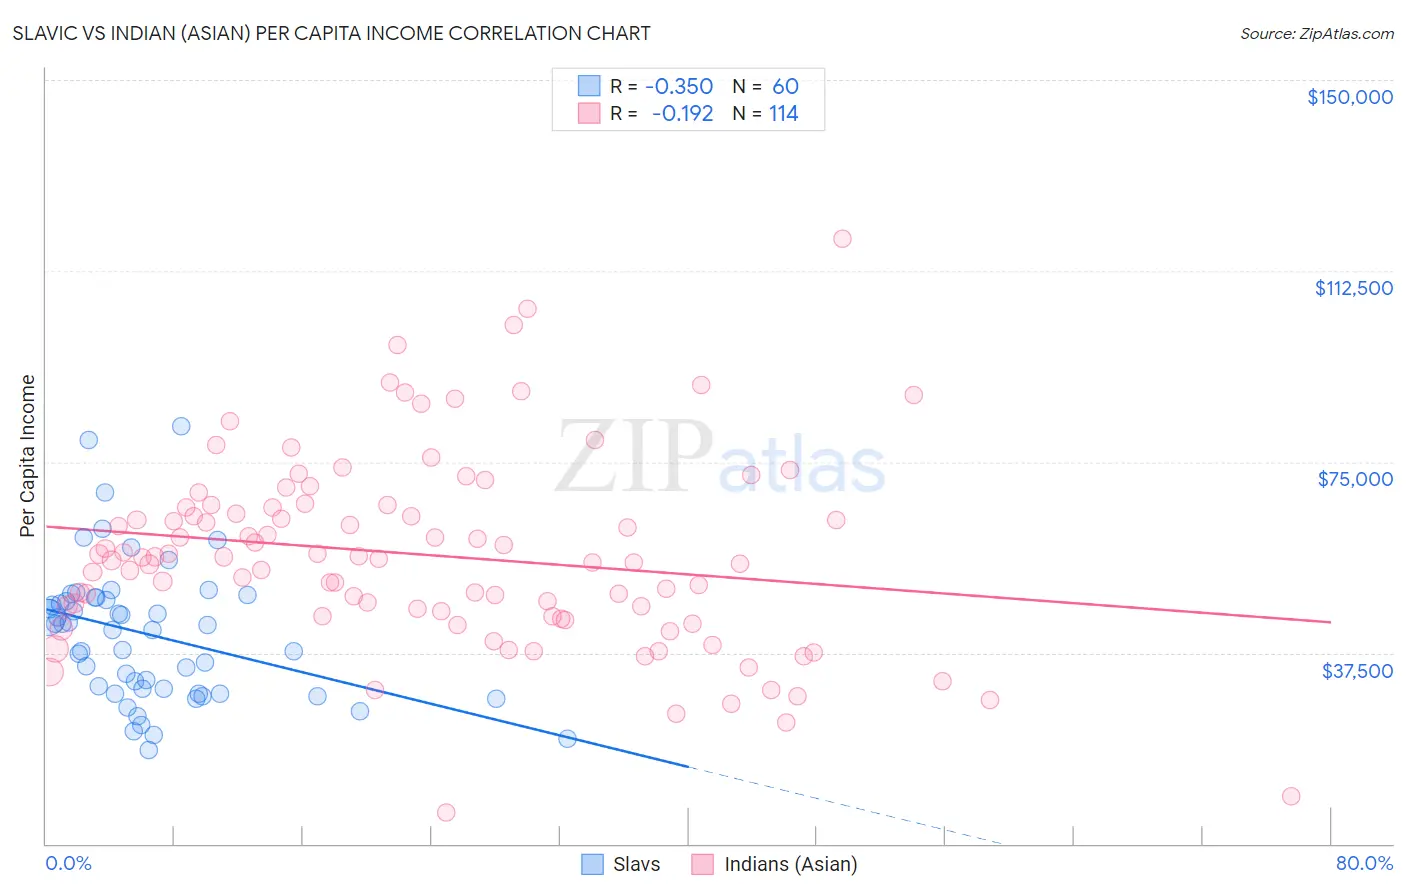
Slavic vs Indian (Asian) Per Capita Income Correlation Chart
The statistical analysis conducted on geographies consisting of 270,856,611 people shows a mild negative correlation between the proportion of Slavs and per capita income in the United States with a correlation coefficient (R) of -0.350 and weighted average of $45,049. Similarly, the statistical analysis conducted on geographies consisting of 495,399,283 people shows a poor negative correlation between the proportion of Indians (Asian) and per capita income in the United States with a correlation coefficient (R) of -0.192 and weighted average of $53,874, a difference of 19.6%.
Per Capita Income Correlation Summary
| Measurement | Slavic | Indian (Asian) |
| Minimum | $18,507 | $6,086 |
| Maximum | $81,943 | $118,834 |
| Range | $63,436 | $112,748 |
| Mean | $41,079 | $56,707 |
| Median | $42,528 | $56,072 |
| Interquartile 25% (IQ1) | $30,000 | $44,771 |
| Interquartile 75% (IQ3) | $48,077 | $66,146 |
| Interquartile Range (IQR) | $18,077 | $21,374 |
| Standard Deviation (Sample) | $13,481 | $19,017 |
| Standard Deviation (Population) | $13,368 | $18,934 |
Similar Demographics by Per Capita Income
Demographics Similar to Slavs by Per Capita Income
In terms of per capita income, the demographic groups most similar to Slavs are Ugandan ($45,047, a difference of 0.0%), Immigrants from Uganda ($45,043, a difference of 0.010%), Immigrants from Jordan ($45,066, a difference of 0.040%), Basque ($45,086, a difference of 0.080%), and Icelander ($44,987, a difference of 0.14%).
| Demographics | Rating | Rank | Per Capita Income |
| Slovenes | 89.6 /100 | #134 | Excellent $45,581 |
| Hungarians | 87.9 /100 | #135 | Excellent $45,426 |
| Immigrants | Oceania | 85.2 /100 | #136 | Excellent $45,220 |
| Immigrants | Syria | 85.2 /100 | #137 | Excellent $45,218 |
| Assyrians/Chaldeans/Syriacs | 84.8 /100 | #138 | Excellent $45,195 |
| Basques | 83.2 /100 | #139 | Excellent $45,086 |
| Immigrants | Jordan | 82.9 /100 | #140 | Excellent $45,066 |
| Slavs | 82.6 /100 | #141 | Excellent $45,049 |
| Ugandans | 82.6 /100 | #142 | Excellent $45,047 |
| Immigrants | Uganda | 82.5 /100 | #143 | Excellent $45,043 |
| Icelanders | 81.6 /100 | #144 | Excellent $44,987 |
| Immigrants | Afghanistan | 78.0 /100 | #145 | Good $44,790 |
| Irish | 75.8 /100 | #146 | Good $44,679 |
| Czechs | 74.1 /100 | #147 | Good $44,595 |
| Immigrants | Armenia | 73.1 /100 | #148 | Good $44,552 |
Demographics Similar to Indians (Asian) by Per Capita Income
In terms of per capita income, the demographic groups most similar to Indians (Asian) are Immigrants from Eastern Asia ($53,806, a difference of 0.13%), Immigrants from Denmark ($53,799, a difference of 0.14%), Immigrants from Northern Europe ($54,159, a difference of 0.53%), Soviet Union ($54,202, a difference of 0.61%), and Immigrants from China ($54,264, a difference of 0.72%).
| Demographics | Rating | Rank | Per Capita Income |
| Cypriots | 100.0 /100 | #15 | Exceptional $54,899 |
| Immigrants | Switzerland | 100.0 /100 | #16 | Exceptional $54,866 |
| Immigrants | France | 100.0 /100 | #17 | Exceptional $54,557 |
| Thais | 100.0 /100 | #18 | Exceptional $54,307 |
| Immigrants | China | 100.0 /100 | #19 | Exceptional $54,264 |
| Soviet Union | 100.0 /100 | #20 | Exceptional $54,202 |
| Immigrants | Northern Europe | 100.0 /100 | #21 | Exceptional $54,159 |
| Indians (Asian) | 100.0 /100 | #22 | Exceptional $53,874 |
| Immigrants | Eastern Asia | 100.0 /100 | #23 | Exceptional $53,806 |
| Immigrants | Denmark | 100.0 /100 | #24 | Exceptional $53,799 |
| Immigrants | Japan | 100.0 /100 | #25 | Exceptional $53,359 |
| Russians | 100.0 /100 | #26 | Exceptional $53,154 |
| Immigrants | South Central Asia | 100.0 /100 | #27 | Exceptional $52,660 |
| Latvians | 100.0 /100 | #28 | Exceptional $52,649 |
| Israelis | 100.0 /100 | #29 | Exceptional $52,596 |