Slavic vs Immigrants from Micronesia Hearing Disability
COMPARE
Slavic
Immigrants from Micronesia
Hearing Disability
Hearing Disability Comparison
Slavs
Immigrants from Micronesia
3.4%
HEARING DISABILITY
0.2/ 100
METRIC RATING
254th/ 347
METRIC RANK
3.6%
HEARING DISABILITY
0.0/ 100
METRIC RATING
284th/ 347
METRIC RANK
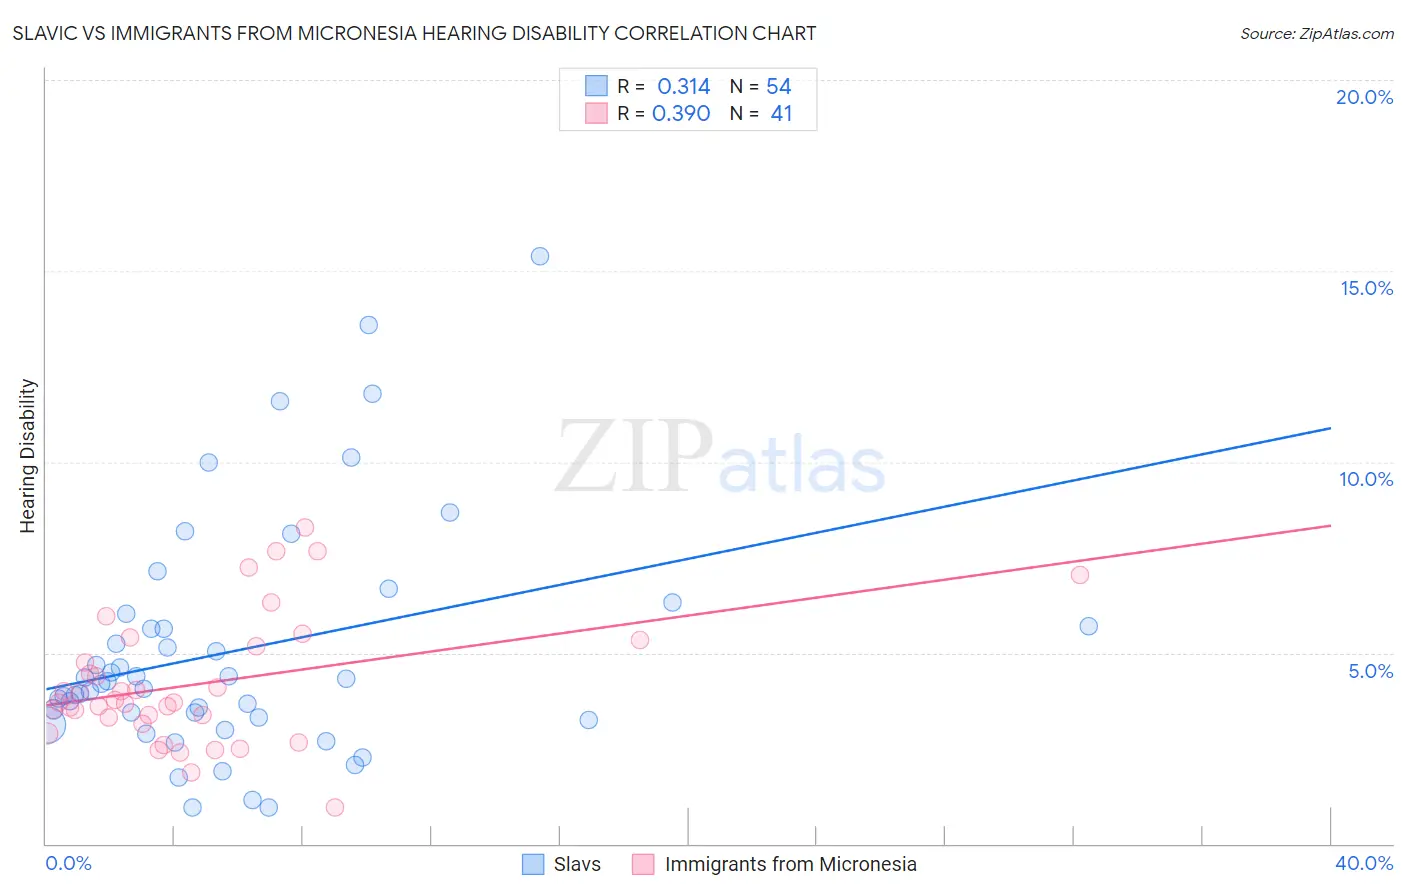
Slavic vs Immigrants from Micronesia Hearing Disability Correlation Chart
The statistical analysis conducted on geographies consisting of 270,835,227 people shows a mild positive correlation between the proportion of Slavs and percentage of population with hearing disability in the United States with a correlation coefficient (R) of 0.314 and weighted average of 3.4%. Similarly, the statistical analysis conducted on geographies consisting of 61,571,730 people shows a mild positive correlation between the proportion of Immigrants from Micronesia and percentage of population with hearing disability in the United States with a correlation coefficient (R) of 0.390 and weighted average of 3.6%, a difference of 6.3%.
Hearing Disability Correlation Summary
| Measurement | Slavic | Immigrants from Micronesia |
| Minimum | 0.96% | 0.94% |
| Maximum | 15.4% | 8.3% |
| Range | 14.4% | 7.3% |
| Mean | 5.0% | 4.2% |
| Median | 4.2% | 3.7% |
| Interquartile 25% (IQ1) | 3.3% | 3.2% |
| Interquartile 75% (IQ3) | 5.7% | 5.3% |
| Interquartile Range (IQR) | 2.4% | 2.0% |
| Standard Deviation (Sample) | 3.1% | 1.7% |
| Standard Deviation (Population) | 3.1% | 1.7% |
Similar Demographics by Hearing Disability
Demographics Similar to Slavs by Hearing Disability
In terms of hearing disability, the demographic groups most similar to Slavs are Polish (3.4%, a difference of 0.23%), Hmong (3.4%, a difference of 0.27%), Carpatho Rusyn (3.4%, a difference of 0.42%), Yaqui (3.4%, a difference of 0.73%), and Northern European (3.4%, a difference of 0.79%).
| Demographics | Rating | Rank | Hearing Disability |
| Lithuanians | 0.6 /100 | #247 | Tragic 3.4% |
| Austrians | 0.6 /100 | #248 | Tragic 3.4% |
| Italians | 0.4 /100 | #249 | Tragic 3.4% |
| Yuman | 0.4 /100 | #250 | Tragic 3.4% |
| Hungarians | 0.4 /100 | #251 | Tragic 3.4% |
| Croatians | 0.4 /100 | #252 | Tragic 3.4% |
| Carpatho Rusyns | 0.3 /100 | #253 | Tragic 3.4% |
| Slavs | 0.2 /100 | #254 | Tragic 3.4% |
| Poles | 0.2 /100 | #255 | Tragic 3.4% |
| Hmong | 0.2 /100 | #256 | Tragic 3.4% |
| Yaqui | 0.2 /100 | #257 | Tragic 3.4% |
| Northern Europeans | 0.2 /100 | #258 | Tragic 3.4% |
| Slovenes | 0.1 /100 | #259 | Tragic 3.5% |
| Portuguese | 0.1 /100 | #260 | Tragic 3.5% |
| Hawaiians | 0.1 /100 | #261 | Tragic 3.5% |
Demographics Similar to Immigrants from Micronesia by Hearing Disability
In terms of hearing disability, the demographic groups most similar to Immigrants from Micronesia are Sioux (3.6%, a difference of 0.10%), Delaware (3.6%, a difference of 0.13%), Spanish (3.7%, a difference of 0.38%), Blackfeet (3.6%, a difference of 0.47%), and Swedish (3.6%, a difference of 0.72%).
| Demographics | Rating | Rank | Hearing Disability |
| Immigrants | Nonimmigrants | 0.0 /100 | #277 | Tragic 3.6% |
| Basques | 0.0 /100 | #278 | Tragic 3.6% |
| Slovaks | 0.0 /100 | #279 | Tragic 3.6% |
| French American Indians | 0.0 /100 | #280 | Tragic 3.6% |
| Scandinavians | 0.0 /100 | #281 | Tragic 3.6% |
| Swedes | 0.0 /100 | #282 | Tragic 3.6% |
| Blackfeet | 0.0 /100 | #283 | Tragic 3.6% |
| Immigrants | Micronesia | 0.0 /100 | #284 | Tragic 3.6% |
| Sioux | 0.0 /100 | #285 | Tragic 3.6% |
| Delaware | 0.0 /100 | #286 | Tragic 3.6% |
| Spanish | 0.0 /100 | #287 | Tragic 3.7% |
| Irish | 0.0 /100 | #288 | Tragic 3.7% |
| Chinese | 0.0 /100 | #289 | Tragic 3.7% |
| Whites/Caucasians | 0.0 /100 | #290 | Tragic 3.7% |
| Finns | 0.0 /100 | #291 | Tragic 3.7% |