Thai vs Immigrants from Greece Median Female Earnings
COMPARE
Thai
Immigrants from Greece
Median Female Earnings
Median Female Earnings Comparison
Thais
Immigrants from Greece
$47,577
MEDIAN FEMALE EARNINGS
100.0/ 100
METRIC RATING
7th/ 347
METRIC RANK
$44,976
MEDIAN FEMALE EARNINGS
100.0/ 100
METRIC RATING
22nd/ 347
METRIC RANK
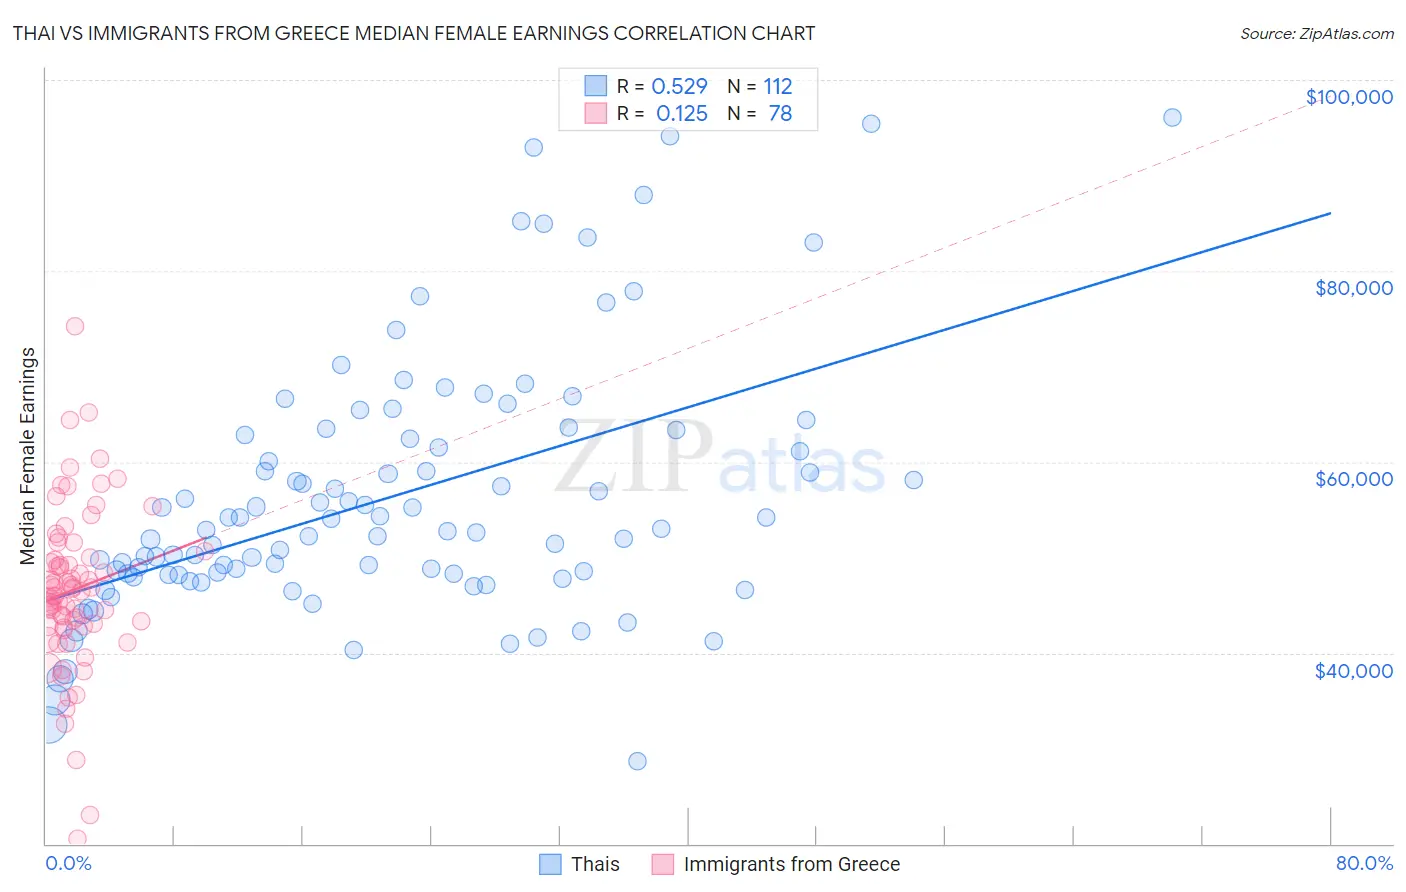
Thai vs Immigrants from Greece Median Female Earnings Correlation Chart
The statistical analysis conducted on geographies consisting of 475,636,214 people shows a substantial positive correlation between the proportion of Thais and median female earnings in the United States with a correlation coefficient (R) of 0.529 and weighted average of $47,577. Similarly, the statistical analysis conducted on geographies consisting of 216,834,744 people shows a poor positive correlation between the proportion of Immigrants from Greece and median female earnings in the United States with a correlation coefficient (R) of 0.125 and weighted average of $44,976, a difference of 5.8%.
Median Female Earnings Correlation Summary
| Measurement | Thai | Immigrants from Greece |
| Minimum | $28,625 | $20,568 |
| Maximum | $96,063 | $74,175 |
| Range | $67,438 | $53,607 |
| Mean | $56,190 | $46,608 |
| Median | $52,820 | $46,610 |
| Interquartile 25% (IQ1) | $48,126 | $42,848 |
| Interquartile 75% (IQ3) | $62,651 | $50,040 |
| Interquartile Range (IQR) | $14,524 | $7,192 |
| Standard Deviation (Sample) | $13,471 | $8,519 |
| Standard Deviation (Population) | $13,411 | $8,464 |
Demographics Similar to Thais and Immigrants from Greece by Median Female Earnings
In terms of median female earnings, the demographic groups most similar to Thais are Immigrants from Ireland ($47,598, a difference of 0.040%), Iranian ($47,421, a difference of 0.33%), Immigrants from Singapore ($47,986, a difference of 0.86%), Immigrants from Iran ($47,154, a difference of 0.90%), and Immigrants from China ($46,972, a difference of 1.3%). Similarly, the demographic groups most similar to Immigrants from Greece are Cambodian ($45,014, a difference of 0.080%), Burmese ($44,911, a difference of 0.14%), Immigrants from Korea ($44,847, a difference of 0.29%), Immigrants from Japan ($45,323, a difference of 0.77%), and Eastern European ($45,385, a difference of 0.91%).
| Demographics | Rating | Rank | Median Female Earnings |
| Immigrants | India | 100.0 /100 | #4 | Exceptional $48,292 |
| Immigrants | Singapore | 100.0 /100 | #5 | Exceptional $47,986 |
| Immigrants | Ireland | 100.0 /100 | #6 | Exceptional $47,598 |
| Thais | 100.0 /100 | #7 | Exceptional $47,577 |
| Iranians | 100.0 /100 | #8 | Exceptional $47,421 |
| Immigrants | Iran | 100.0 /100 | #9 | Exceptional $47,154 |
| Immigrants | China | 100.0 /100 | #10 | Exceptional $46,972 |
| Okinawans | 100.0 /100 | #11 | Exceptional $46,905 |
| Immigrants | Israel | 100.0 /100 | #12 | Exceptional $46,902 |
| Immigrants | Australia | 100.0 /100 | #13 | Exceptional $46,573 |
| Soviet Union | 100.0 /100 | #14 | Exceptional $46,556 |
| Immigrants | Eastern Asia | 100.0 /100 | #15 | Exceptional $46,502 |
| Indians (Asian) | 100.0 /100 | #16 | Exceptional $46,481 |
| Immigrants | South Central Asia | 100.0 /100 | #17 | Exceptional $46,324 |
| Cypriots | 100.0 /100 | #18 | Exceptional $45,570 |
| Eastern Europeans | 100.0 /100 | #19 | Exceptional $45,385 |
| Immigrants | Japan | 100.0 /100 | #20 | Exceptional $45,323 |
| Cambodians | 100.0 /100 | #21 | Exceptional $45,014 |
| Immigrants | Greece | 100.0 /100 | #22 | Exceptional $44,976 |
| Burmese | 100.0 /100 | #23 | Exceptional $44,911 |
| Immigrants | Korea | 100.0 /100 | #24 | Exceptional $44,847 |