Immigrants from Cuba vs Immigrants from Greece Median Female Earnings
COMPARE
Immigrants from Cuba
Immigrants from Greece
Median Female Earnings
Median Female Earnings Comparison
Immigrants from Cuba
Immigrants from Greece
$33,291
MEDIAN FEMALE EARNINGS
0.0/ 100
METRIC RATING
338th/ 347
METRIC RANK
$44,976
MEDIAN FEMALE EARNINGS
100.0/ 100
METRIC RATING
22nd/ 347
METRIC RANK
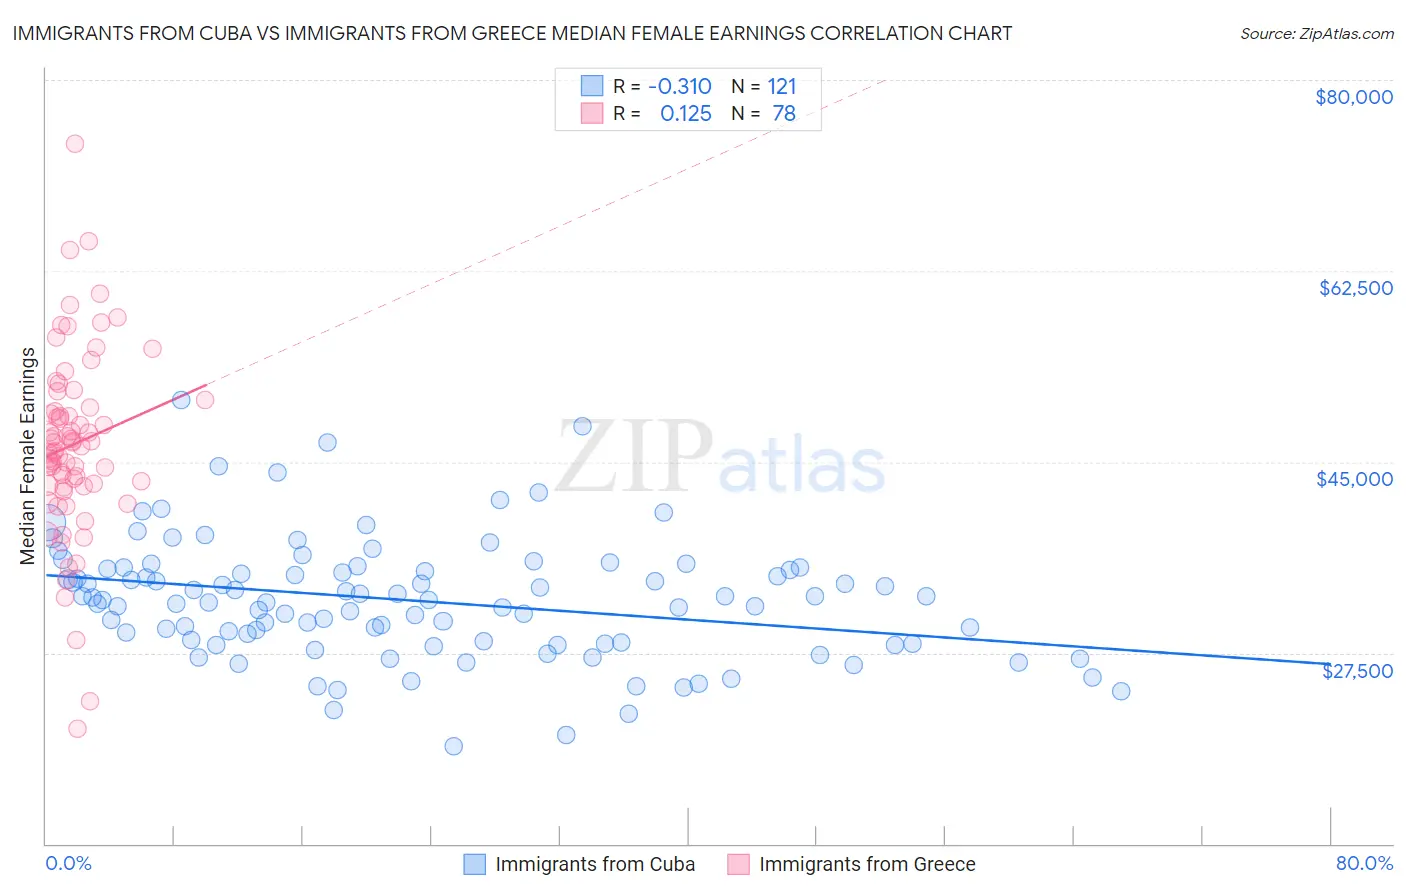
Immigrants from Cuba vs Immigrants from Greece Median Female Earnings Correlation Chart
The statistical analysis conducted on geographies consisting of 325,881,101 people shows a mild negative correlation between the proportion of Immigrants from Cuba and median female earnings in the United States with a correlation coefficient (R) of -0.310 and weighted average of $33,291. Similarly, the statistical analysis conducted on geographies consisting of 216,834,744 people shows a poor positive correlation between the proportion of Immigrants from Greece and median female earnings in the United States with a correlation coefficient (R) of 0.125 and weighted average of $44,976, a difference of 35.1%.
Median Female Earnings Correlation Summary
| Measurement | Immigrants from Cuba | Immigrants from Greece |
| Minimum | $18,945 | $20,568 |
| Maximum | $50,658 | $74,175 |
| Range | $31,713 | $53,607 |
| Mean | $32,289 | $46,608 |
| Median | $32,306 | $46,610 |
| Interquartile 25% (IQ1) | $28,389 | $42,848 |
| Interquartile 75% (IQ3) | $35,158 | $50,040 |
| Interquartile Range (IQR) | $6,769 | $7,192 |
| Standard Deviation (Sample) | $5,505 | $8,519 |
| Standard Deviation (Population) | $5,482 | $8,464 |
Similar Demographics by Median Female Earnings
Demographics Similar to Immigrants from Cuba by Median Female Earnings
In terms of median female earnings, the demographic groups most similar to Immigrants from Cuba are Immigrants from Mexico ($33,236, a difference of 0.17%), Yakama ($33,354, a difference of 0.19%), Ottawa ($33,378, a difference of 0.26%), Tohono O'odham ($33,205, a difference of 0.26%), and Creek ($33,437, a difference of 0.44%).
| Demographics | Rating | Rank | Median Female Earnings |
| Natives/Alaskans | 0.0 /100 | #331 | Tragic $33,806 |
| Choctaw | 0.0 /100 | #332 | Tragic $33,775 |
| Mexicans | 0.0 /100 | #333 | Tragic $33,664 |
| Spanish American Indians | 0.0 /100 | #334 | Tragic $33,625 |
| Creek | 0.0 /100 | #335 | Tragic $33,437 |
| Ottawa | 0.0 /100 | #336 | Tragic $33,378 |
| Yakama | 0.0 /100 | #337 | Tragic $33,354 |
| Immigrants | Cuba | 0.0 /100 | #338 | Tragic $33,291 |
| Immigrants | Mexico | 0.0 /100 | #339 | Tragic $33,236 |
| Tohono O'odham | 0.0 /100 | #340 | Tragic $33,205 |
| Navajo | 0.0 /100 | #341 | Tragic $33,046 |
| Yup'ik | 0.0 /100 | #342 | Tragic $32,730 |
| Pueblo | 0.0 /100 | #343 | Tragic $32,564 |
| Lumbee | 0.0 /100 | #344 | Tragic $32,500 |
| Puerto Ricans | 0.0 /100 | #345 | Tragic $31,560 |
Demographics Similar to Immigrants from Greece by Median Female Earnings
In terms of median female earnings, the demographic groups most similar to Immigrants from Greece are Cambodian ($45,014, a difference of 0.080%), Burmese ($44,911, a difference of 0.14%), Immigrants from Korea ($44,847, a difference of 0.29%), Immigrants from Sweden ($44,774, a difference of 0.45%), and Immigrants from Belarus ($44,757, a difference of 0.49%).
| Demographics | Rating | Rank | Median Female Earnings |
| Immigrants | Eastern Asia | 100.0 /100 | #15 | Exceptional $46,502 |
| Indians (Asian) | 100.0 /100 | #16 | Exceptional $46,481 |
| Immigrants | South Central Asia | 100.0 /100 | #17 | Exceptional $46,324 |
| Cypriots | 100.0 /100 | #18 | Exceptional $45,570 |
| Eastern Europeans | 100.0 /100 | #19 | Exceptional $45,385 |
| Immigrants | Japan | 100.0 /100 | #20 | Exceptional $45,323 |
| Cambodians | 100.0 /100 | #21 | Exceptional $45,014 |
| Immigrants | Greece | 100.0 /100 | #22 | Exceptional $44,976 |
| Burmese | 100.0 /100 | #23 | Exceptional $44,911 |
| Immigrants | Korea | 100.0 /100 | #24 | Exceptional $44,847 |
| Immigrants | Sweden | 100.0 /100 | #25 | Exceptional $44,774 |
| Immigrants | Belarus | 100.0 /100 | #26 | Exceptional $44,757 |
| Turks | 100.0 /100 | #27 | Exceptional $44,695 |
| Immigrants | Russia | 100.0 /100 | #28 | Exceptional $44,680 |
| Immigrants | Belgium | 100.0 /100 | #29 | Exceptional $44,587 |