Serbian vs Immigrants from Trinidad and Tobago Median Earnings
COMPARE
Serbian
Immigrants from Trinidad and Tobago
Median Earnings
Median Earnings Comparison
Serbians
Immigrants from Trinidad and Tobago
$48,677
MEDIAN EARNINGS
95.9/ 100
METRIC RATING
117th/ 347
METRIC RANK
$45,729
MEDIAN EARNINGS
27.1/ 100
METRIC RATING
202nd/ 347
METRIC RANK
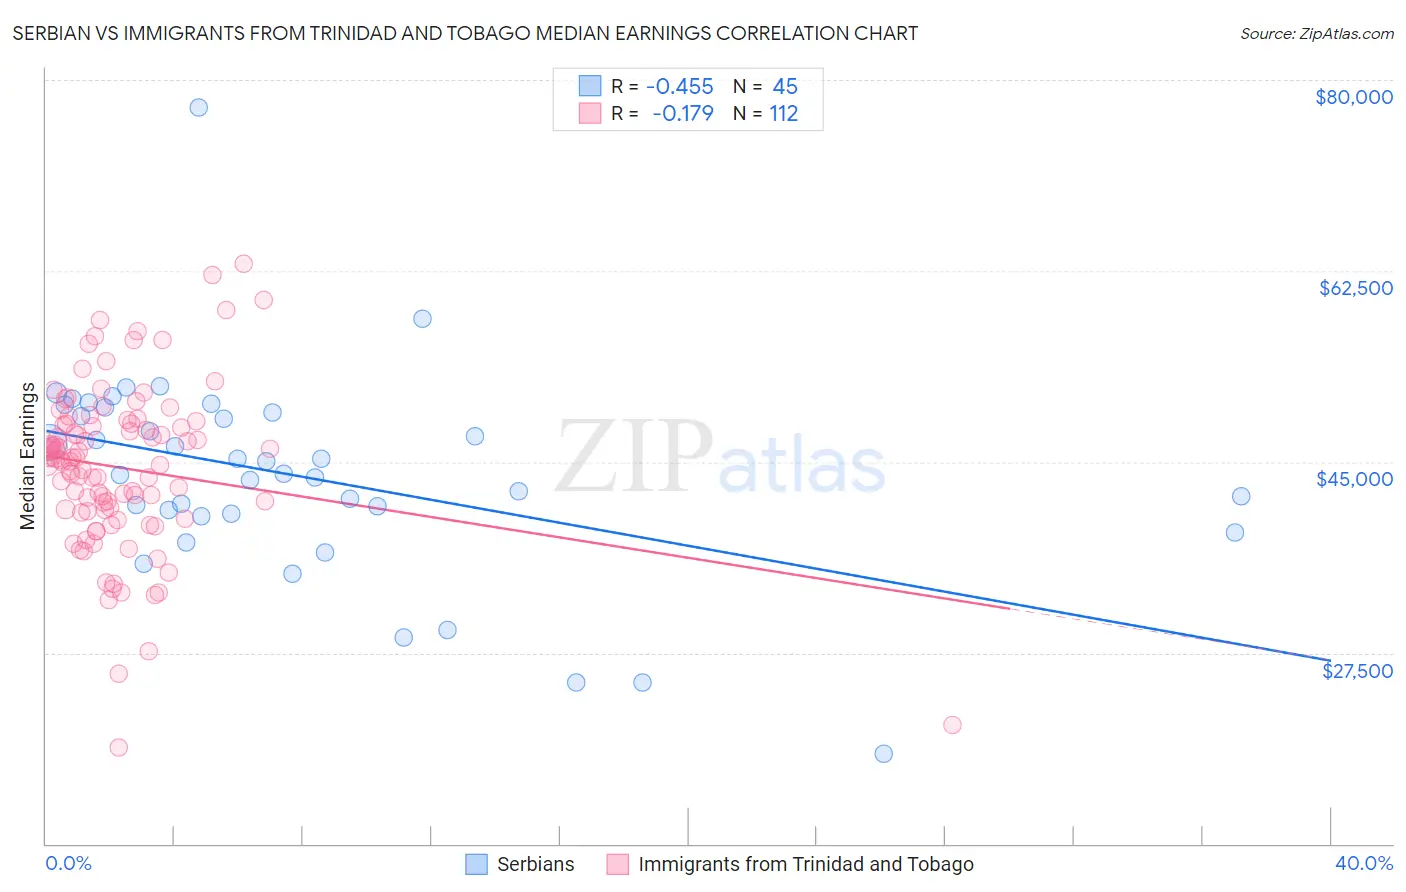
Serbian vs Immigrants from Trinidad and Tobago Median Earnings Correlation Chart
The statistical analysis conducted on geographies consisting of 267,654,810 people shows a moderate negative correlation between the proportion of Serbians and median earnings in the United States with a correlation coefficient (R) of -0.455 and weighted average of $48,677. Similarly, the statistical analysis conducted on geographies consisting of 223,533,236 people shows a poor negative correlation between the proportion of Immigrants from Trinidad and Tobago and median earnings in the United States with a correlation coefficient (R) of -0.179 and weighted average of $45,729, a difference of 6.5%.
Median Earnings Correlation Summary
| Measurement | Serbian | Immigrants from Trinidad and Tobago |
| Minimum | $18,250 | $18,800 |
| Maximum | $77,452 | $63,173 |
| Range | $59,202 | $44,373 |
| Mean | $43,689 | $44,457 |
| Median | $43,879 | $45,233 |
| Interquartile 25% (IQ1) | $40,125 | $40,492 |
| Interquartile 75% (IQ3) | $49,731 | $48,494 |
| Interquartile Range (IQR) | $9,606 | $8,002 |
| Standard Deviation (Sample) | $9,625 | $7,633 |
| Standard Deviation (Population) | $9,517 | $7,598 |
Similar Demographics by Median Earnings
Demographics Similar to Serbians by Median Earnings
In terms of median earnings, the demographic groups most similar to Serbians are Immigrants from Jordan ($48,673, a difference of 0.010%), Polish ($48,659, a difference of 0.040%), Korean ($48,727, a difference of 0.10%), Carpatho Rusyn ($48,617, a difference of 0.12%), and Arab ($48,599, a difference of 0.16%).
| Demographics | Rating | Rank | Median Earnings |
| Immigrants | Ethiopia | 97.1 /100 | #110 | Exceptional $48,924 |
| Immigrants | Zimbabwe | 97.0 /100 | #111 | Exceptional $48,913 |
| Northern Europeans | 96.9 /100 | #112 | Exceptional $48,887 |
| Immigrants | Kuwait | 96.8 /100 | #113 | Exceptional $48,861 |
| Moroccans | 96.7 /100 | #114 | Exceptional $48,838 |
| Chinese | 96.7 /100 | #115 | Exceptional $48,836 |
| Koreans | 96.2 /100 | #116 | Exceptional $48,727 |
| Serbians | 95.9 /100 | #117 | Exceptional $48,677 |
| Immigrants | Jordan | 95.9 /100 | #118 | Exceptional $48,673 |
| Poles | 95.8 /100 | #119 | Exceptional $48,659 |
| Carpatho Rusyns | 95.5 /100 | #120 | Exceptional $48,617 |
| Arabs | 95.4 /100 | #121 | Exceptional $48,599 |
| Chileans | 94.8 /100 | #122 | Exceptional $48,504 |
| Immigrants | Syria | 93.9 /100 | #123 | Exceptional $48,375 |
| Brazilians | 93.7 /100 | #124 | Exceptional $48,356 |
Demographics Similar to Immigrants from Trinidad and Tobago by Median Earnings
In terms of median earnings, the demographic groups most similar to Immigrants from Trinidad and Tobago are Celtic ($45,732, a difference of 0.010%), Welsh ($45,710, a difference of 0.040%), Immigrants from Uruguay ($45,682, a difference of 0.10%), Tongan ($45,665, a difference of 0.14%), and Immigrants from the Azores ($45,812, a difference of 0.18%).
| Demographics | Rating | Rank | Median Earnings |
| Immigrants | St. Vincent and the Grenadines | 32.4 /100 | #195 | Fair $45,908 |
| Yugoslavians | 30.5 /100 | #196 | Fair $45,846 |
| Barbadians | 30.5 /100 | #197 | Fair $45,846 |
| Trinidadians and Tobagonians | 29.7 /100 | #198 | Fair $45,820 |
| Immigrants | Barbados | 29.6 /100 | #199 | Fair $45,816 |
| Immigrants | Azores | 29.5 /100 | #200 | Fair $45,812 |
| Celtics | 27.2 /100 | #201 | Fair $45,732 |
| Immigrants | Trinidad and Tobago | 27.1 /100 | #202 | Fair $45,729 |
| Welsh | 26.6 /100 | #203 | Fair $45,710 |
| Immigrants | Uruguay | 25.9 /100 | #204 | Fair $45,682 |
| Tongans | 25.4 /100 | #205 | Fair $45,665 |
| Immigrants | Ghana | 24.8 /100 | #206 | Fair $45,641 |
| Immigrants | Senegal | 24.0 /100 | #207 | Fair $45,611 |
| Immigrants | Bosnia and Herzegovina | 23.7 /100 | #208 | Fair $45,600 |
| Immigrants | Thailand | 23.7 /100 | #209 | Fair $45,598 |