Latvian vs Immigrants from Trinidad and Tobago Median Earnings
COMPARE
Latvian
Immigrants from Trinidad and Tobago
Median Earnings
Median Earnings Comparison
Latvians
Immigrants from Trinidad and Tobago
$53,001
MEDIAN EARNINGS
100.0/ 100
METRIC RATING
38th/ 347
METRIC RANK
$45,729
MEDIAN EARNINGS
27.1/ 100
METRIC RATING
202nd/ 347
METRIC RANK
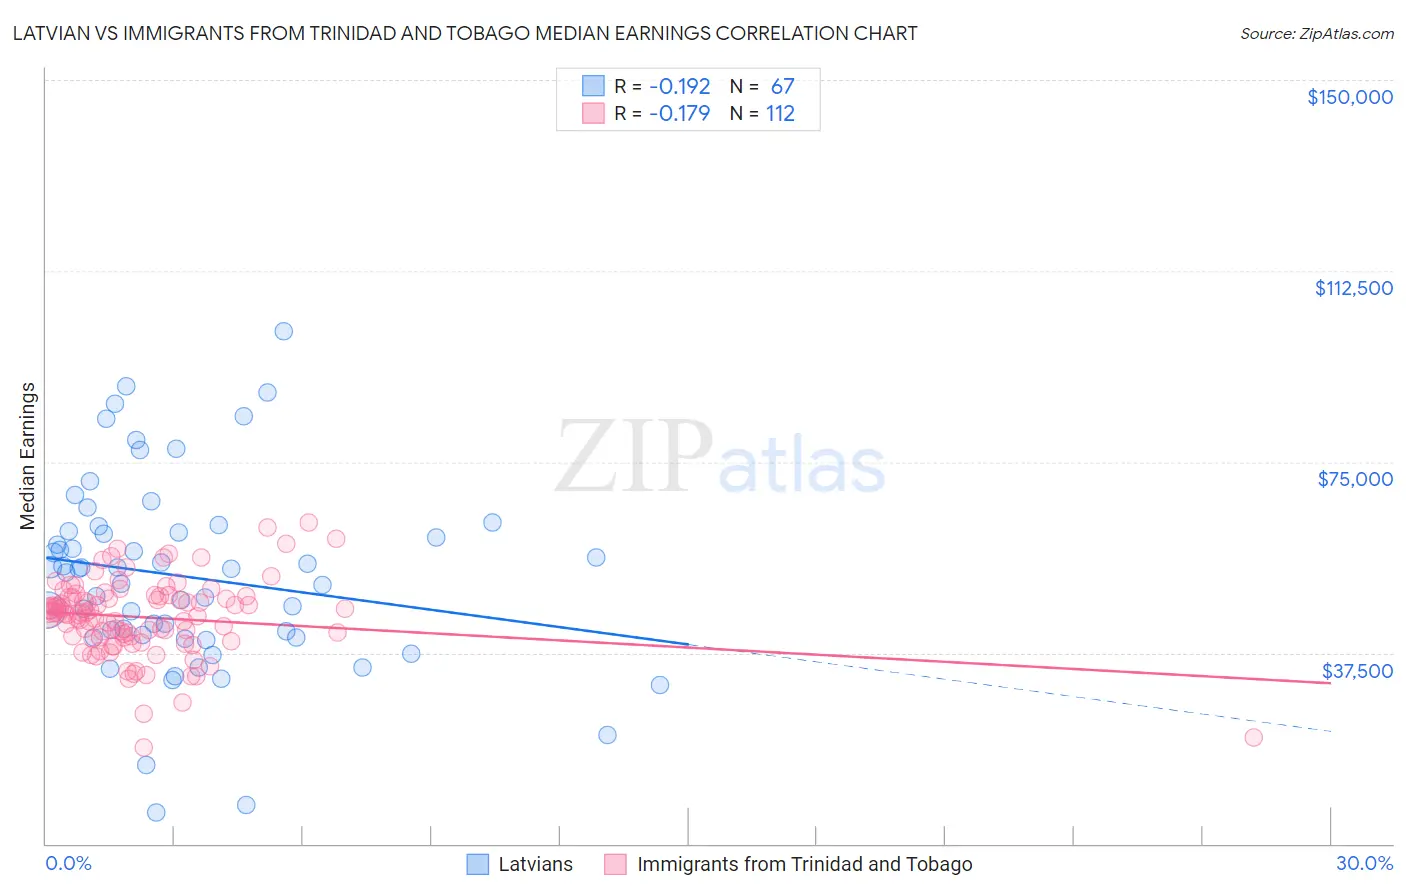
Latvian vs Immigrants from Trinidad and Tobago Median Earnings Correlation Chart
The statistical analysis conducted on geographies consisting of 220,722,204 people shows a poor negative correlation between the proportion of Latvians and median earnings in the United States with a correlation coefficient (R) of -0.192 and weighted average of $53,001. Similarly, the statistical analysis conducted on geographies consisting of 223,533,236 people shows a poor negative correlation between the proportion of Immigrants from Trinidad and Tobago and median earnings in the United States with a correlation coefficient (R) of -0.179 and weighted average of $45,729, a difference of 15.9%.
Median Earnings Correlation Summary
| Measurement | Latvian | Immigrants from Trinidad and Tobago |
| Minimum | $6,196 | $18,800 |
| Maximum | $100,625 | $63,173 |
| Range | $94,429 | $44,373 |
| Mean | $52,387 | $44,457 |
| Median | $53,984 | $45,233 |
| Interquartile 25% (IQ1) | $40,578 | $40,492 |
| Interquartile 75% (IQ3) | $61,313 | $48,494 |
| Interquartile Range (IQR) | $20,735 | $8,002 |
| Standard Deviation (Sample) | $18,625 | $7,633 |
| Standard Deviation (Population) | $18,485 | $7,598 |
Similar Demographics by Median Earnings
Demographics Similar to Latvians by Median Earnings
In terms of median earnings, the demographic groups most similar to Latvians are Immigrants from Belarus ($53,043, a difference of 0.080%), Immigrants from Turkey ($52,960, a difference of 0.080%), Israeli ($52,937, a difference of 0.12%), Immigrants from Denmark ($53,186, a difference of 0.35%), and Immigrants from Switzerland ($53,211, a difference of 0.40%).
| Demographics | Rating | Rank | Median Earnings |
| Russians | 100.0 /100 | #31 | Exceptional $53,334 |
| Immigrants | Asia | 100.0 /100 | #32 | Exceptional $53,310 |
| Immigrants | Greece | 100.0 /100 | #33 | Exceptional $53,282 |
| Immigrants | Sri Lanka | 100.0 /100 | #34 | Exceptional $53,268 |
| Immigrants | Switzerland | 100.0 /100 | #35 | Exceptional $53,211 |
| Immigrants | Denmark | 100.0 /100 | #36 | Exceptional $53,186 |
| Immigrants | Belarus | 100.0 /100 | #37 | Exceptional $53,043 |
| Latvians | 100.0 /100 | #38 | Exceptional $53,001 |
| Immigrants | Turkey | 100.0 /100 | #39 | Exceptional $52,960 |
| Israelis | 100.0 /100 | #40 | Exceptional $52,937 |
| Immigrants | Lithuania | 100.0 /100 | #41 | Exceptional $52,769 |
| Maltese | 100.0 /100 | #42 | Exceptional $52,526 |
| Immigrants | Malaysia | 100.0 /100 | #43 | Exceptional $52,514 |
| Bulgarians | 100.0 /100 | #44 | Exceptional $52,512 |
| Immigrants | Czechoslovakia | 100.0 /100 | #45 | Exceptional $52,361 |
Demographics Similar to Immigrants from Trinidad and Tobago by Median Earnings
In terms of median earnings, the demographic groups most similar to Immigrants from Trinidad and Tobago are Celtic ($45,732, a difference of 0.010%), Welsh ($45,710, a difference of 0.040%), Immigrants from Uruguay ($45,682, a difference of 0.10%), Tongan ($45,665, a difference of 0.14%), and Immigrants from the Azores ($45,812, a difference of 0.18%).
| Demographics | Rating | Rank | Median Earnings |
| Immigrants | St. Vincent and the Grenadines | 32.4 /100 | #195 | Fair $45,908 |
| Yugoslavians | 30.5 /100 | #196 | Fair $45,846 |
| Barbadians | 30.5 /100 | #197 | Fair $45,846 |
| Trinidadians and Tobagonians | 29.7 /100 | #198 | Fair $45,820 |
| Immigrants | Barbados | 29.6 /100 | #199 | Fair $45,816 |
| Immigrants | Azores | 29.5 /100 | #200 | Fair $45,812 |
| Celtics | 27.2 /100 | #201 | Fair $45,732 |
| Immigrants | Trinidad and Tobago | 27.1 /100 | #202 | Fair $45,729 |
| Welsh | 26.6 /100 | #203 | Fair $45,710 |
| Immigrants | Uruguay | 25.9 /100 | #204 | Fair $45,682 |
| Tongans | 25.4 /100 | #205 | Fair $45,665 |
| Immigrants | Ghana | 24.8 /100 | #206 | Fair $45,641 |
| Immigrants | Senegal | 24.0 /100 | #207 | Fair $45,611 |
| Immigrants | Bosnia and Herzegovina | 23.7 /100 | #208 | Fair $45,600 |
| Immigrants | Thailand | 23.7 /100 | #209 | Fair $45,598 |