Serbian vs Immigrants from Syria Median Earnings
COMPARE
Serbian
Immigrants from Syria
Median Earnings
Median Earnings Comparison
Serbians
Immigrants from Syria
$48,677
MEDIAN EARNINGS
95.9/ 100
METRIC RATING
117th/ 347
METRIC RANK
$48,375
MEDIAN EARNINGS
93.9/ 100
METRIC RATING
123rd/ 347
METRIC RANK
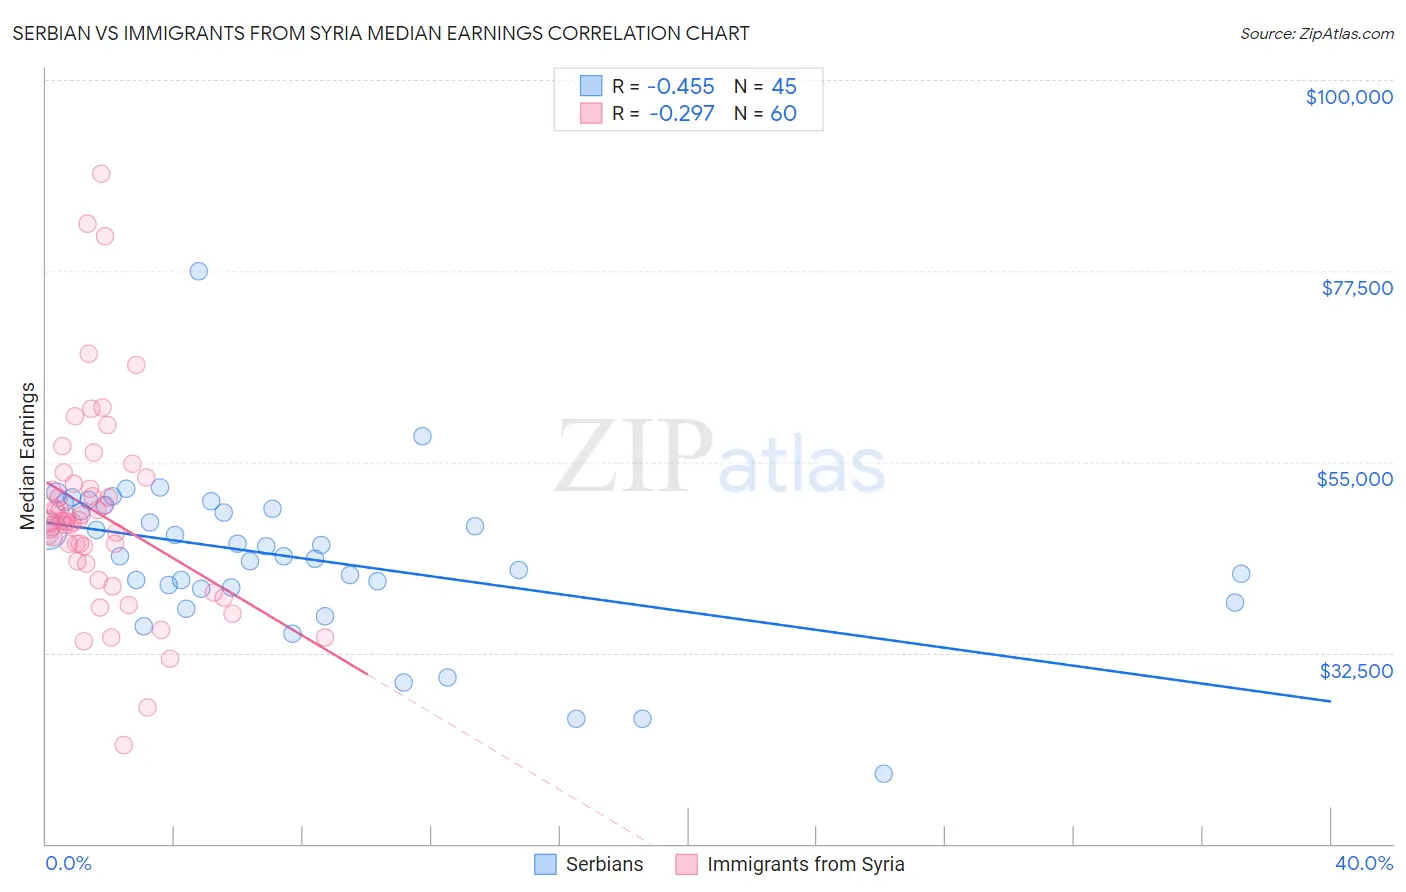
Serbian vs Immigrants from Syria Median Earnings Correlation Chart
The statistical analysis conducted on geographies consisting of 267,654,810 people shows a moderate negative correlation between the proportion of Serbians and median earnings in the United States with a correlation coefficient (R) of -0.455 and weighted average of $48,677. Similarly, the statistical analysis conducted on geographies consisting of 174,102,272 people shows a weak negative correlation between the proportion of Immigrants from Syria and median earnings in the United States with a correlation coefficient (R) of -0.297 and weighted average of $48,375, a difference of 0.62%.
Median Earnings Correlation Summary
| Measurement | Serbian | Immigrants from Syria |
| Minimum | $18,250 | $21,696 |
| Maximum | $77,452 | $88,902 |
| Range | $59,202 | $67,206 |
| Mean | $43,689 | $48,829 |
| Median | $43,879 | $48,019 |
| Interquartile 25% (IQ1) | $40,125 | $43,163 |
| Interquartile 75% (IQ3) | $49,731 | $52,131 |
| Interquartile Range (IQR) | $9,606 | $8,968 |
| Standard Deviation (Sample) | $9,625 | $12,024 |
| Standard Deviation (Population) | $9,517 | $11,923 |
Demographics Similar to Serbians and Immigrants from Syria by Median Earnings
In terms of median earnings, the demographic groups most similar to Serbians are Immigrants from Jordan ($48,673, a difference of 0.010%), Polish ($48,659, a difference of 0.040%), Korean ($48,727, a difference of 0.10%), Carpatho Rusyn ($48,617, a difference of 0.12%), and Arab ($48,599, a difference of 0.16%). Similarly, the demographic groups most similar to Immigrants from Syria are Brazilian ($48,356, a difference of 0.040%), Immigrants from Fiji ($48,305, a difference of 0.14%), Assyrian/Chaldean/Syriac ($48,304, a difference of 0.15%), Sierra Leonean ($48,286, a difference of 0.19%), and Immigrants from Philippines ($48,266, a difference of 0.23%).
| Demographics | Rating | Rank | Median Earnings |
| Immigrants | Ethiopia | 97.1 /100 | #110 | Exceptional $48,924 |
| Immigrants | Zimbabwe | 97.0 /100 | #111 | Exceptional $48,913 |
| Northern Europeans | 96.9 /100 | #112 | Exceptional $48,887 |
| Immigrants | Kuwait | 96.8 /100 | #113 | Exceptional $48,861 |
| Moroccans | 96.7 /100 | #114 | Exceptional $48,838 |
| Chinese | 96.7 /100 | #115 | Exceptional $48,836 |
| Koreans | 96.2 /100 | #116 | Exceptional $48,727 |
| Serbians | 95.9 /100 | #117 | Exceptional $48,677 |
| Immigrants | Jordan | 95.9 /100 | #118 | Exceptional $48,673 |
| Poles | 95.8 /100 | #119 | Exceptional $48,659 |
| Carpatho Rusyns | 95.5 /100 | #120 | Exceptional $48,617 |
| Arabs | 95.4 /100 | #121 | Exceptional $48,599 |
| Chileans | 94.8 /100 | #122 | Exceptional $48,504 |
| Immigrants | Syria | 93.9 /100 | #123 | Exceptional $48,375 |
| Brazilians | 93.7 /100 | #124 | Exceptional $48,356 |
| Immigrants | Fiji | 93.3 /100 | #125 | Exceptional $48,305 |
| Assyrians/Chaldeans/Syriacs | 93.3 /100 | #126 | Exceptional $48,304 |
| Sierra Leoneans | 93.1 /100 | #127 | Exceptional $48,286 |
| Immigrants | Philippines | 92.9 /100 | #128 | Exceptional $48,266 |
| Pakistanis | 92.8 /100 | #129 | Exceptional $48,254 |
| Zimbabweans | 92.6 /100 | #130 | Exceptional $48,229 |