French vs Immigrants from Trinidad and Tobago Median Earnings
COMPARE
French
Immigrants from Trinidad and Tobago
Median Earnings
Median Earnings Comparison
French
Immigrants from Trinidad and Tobago
$46,296
MEDIAN EARNINGS
45.2/ 100
METRIC RATING
183rd/ 347
METRIC RANK
$45,729
MEDIAN EARNINGS
27.1/ 100
METRIC RATING
202nd/ 347
METRIC RANK
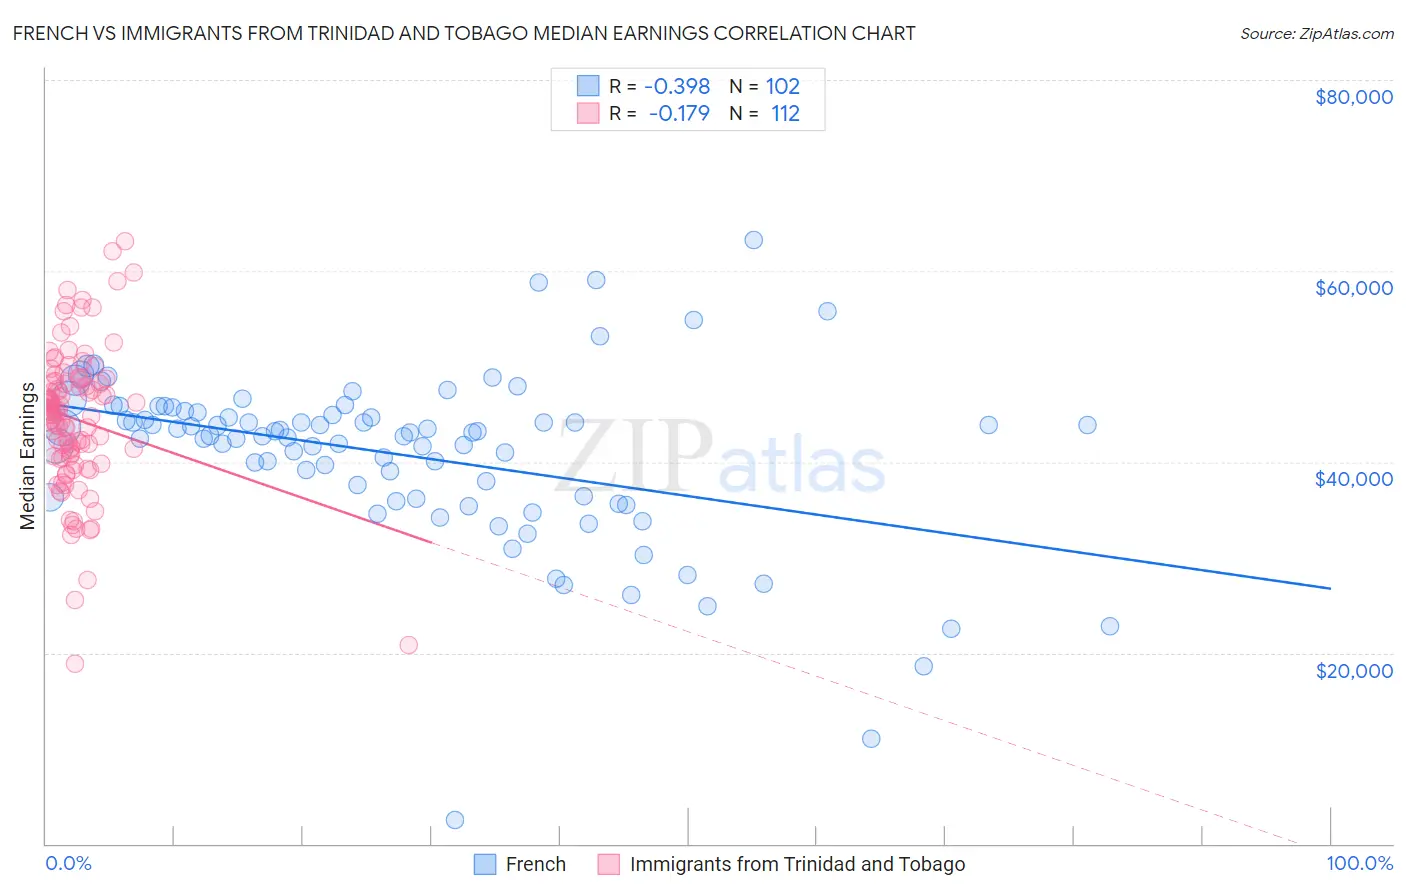
French vs Immigrants from Trinidad and Tobago Median Earnings Correlation Chart
The statistical analysis conducted on geographies consisting of 572,035,046 people shows a mild negative correlation between the proportion of French and median earnings in the United States with a correlation coefficient (R) of -0.398 and weighted average of $46,296. Similarly, the statistical analysis conducted on geographies consisting of 223,533,236 people shows a poor negative correlation between the proportion of Immigrants from Trinidad and Tobago and median earnings in the United States with a correlation coefficient (R) of -0.179 and weighted average of $45,729, a difference of 1.2%.
Median Earnings Correlation Summary
| Measurement | French | Immigrants from Trinidad and Tobago |
| Minimum | $2,499 | $18,800 |
| Maximum | $63,271 | $63,173 |
| Range | $60,772 | $44,373 |
| Mean | $40,779 | $44,457 |
| Median | $42,886 | $45,233 |
| Interquartile 25% (IQ1) | $36,330 | $40,492 |
| Interquartile 75% (IQ3) | $45,125 | $48,494 |
| Interquartile Range (IQR) | $8,794 | $8,002 |
| Standard Deviation (Sample) | $9,085 | $7,633 |
| Standard Deviation (Population) | $9,040 | $7,598 |
Demographics Similar to French and Immigrants from Trinidad and Tobago by Median Earnings
In terms of median earnings, the demographic groups most similar to French are Swiss ($46,315, a difference of 0.040%), Immigrants from Kenya ($46,214, a difference of 0.18%), Uruguayan ($46,190, a difference of 0.23%), Vietnamese ($46,172, a difference of 0.27%), and Iraqi ($46,140, a difference of 0.34%). Similarly, the demographic groups most similar to Immigrants from Trinidad and Tobago are Celtic ($45,732, a difference of 0.010%), Immigrants from the Azores ($45,812, a difference of 0.18%), Immigrants from Barbados ($45,816, a difference of 0.19%), Trinidadian and Tobagonian ($45,820, a difference of 0.20%), and Yugoslavian ($45,846, a difference of 0.26%).
| Demographics | Rating | Rank | Median Earnings |
| Swiss | 45.9 /100 | #182 | Average $46,315 |
| French | 45.2 /100 | #183 | Average $46,296 |
| Immigrants | Kenya | 42.4 /100 | #184 | Average $46,214 |
| Uruguayans | 41.6 /100 | #185 | Average $46,190 |
| Vietnamese | 40.9 /100 | #186 | Average $46,172 |
| Iraqis | 39.9 /100 | #187 | Fair $46,140 |
| Immigrants | Armenia | 38.3 /100 | #188 | Fair $46,094 |
| Spaniards | 37.2 /100 | #189 | Fair $46,059 |
| French Canadians | 36.1 /100 | #190 | Fair $46,026 |
| Finns | 33.4 /100 | #191 | Fair $45,940 |
| Germans | 33.2 /100 | #192 | Fair $45,935 |
| Guamanians/Chamorros | 33.2 /100 | #193 | Fair $45,933 |
| Immigrants | Costa Rica | 33.0 /100 | #194 | Fair $45,928 |
| Immigrants | St. Vincent and the Grenadines | 32.4 /100 | #195 | Fair $45,908 |
| Yugoslavians | 30.5 /100 | #196 | Fair $45,846 |
| Barbadians | 30.5 /100 | #197 | Fair $45,846 |
| Trinidadians and Tobagonians | 29.7 /100 | #198 | Fair $45,820 |
| Immigrants | Barbados | 29.6 /100 | #199 | Fair $45,816 |
| Immigrants | Azores | 29.5 /100 | #200 | Fair $45,812 |
| Celtics | 27.2 /100 | #201 | Fair $45,732 |
| Immigrants | Trinidad and Tobago | 27.1 /100 | #202 | Fair $45,729 |