Immigrants vs Immigrants from Trinidad and Tobago Median Earnings
COMPARE
Immigrants
Immigrants from Trinidad and Tobago
Median Earnings
Median Earnings Comparison
Immigrants
Immigrants from Trinidad and Tobago
$46,478
MEDIAN EARNINGS
51.6/ 100
METRIC RATING
170th/ 347
METRIC RANK
$45,729
MEDIAN EARNINGS
27.1/ 100
METRIC RATING
202nd/ 347
METRIC RANK
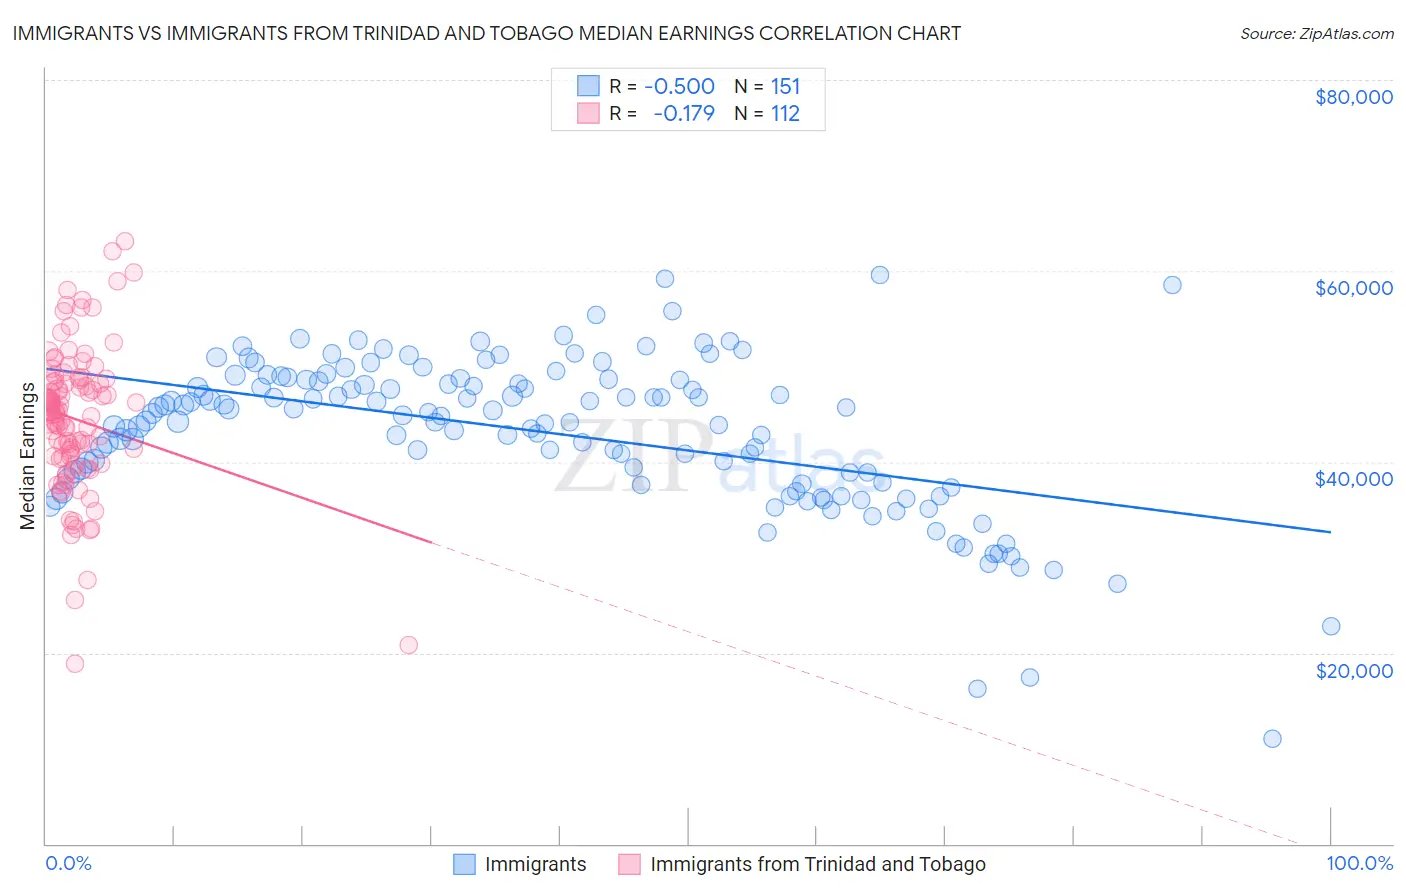
Immigrants vs Immigrants from Trinidad and Tobago Median Earnings Correlation Chart
The statistical analysis conducted on geographies consisting of 576,851,611 people shows a substantial negative correlation between the proportion of Immigrants and median earnings in the United States with a correlation coefficient (R) of -0.500 and weighted average of $46,478. Similarly, the statistical analysis conducted on geographies consisting of 223,533,236 people shows a poor negative correlation between the proportion of Immigrants from Trinidad and Tobago and median earnings in the United States with a correlation coefficient (R) of -0.179 and weighted average of $45,729, a difference of 1.6%.
Median Earnings Correlation Summary
| Measurement | Immigrants | Immigrants from Trinidad and Tobago |
| Minimum | $10,941 | $18,800 |
| Maximum | $59,517 | $63,173 |
| Range | $48,576 | $44,373 |
| Mean | $43,122 | $44,457 |
| Median | $44,875 | $45,233 |
| Interquartile 25% (IQ1) | $37,857 | $40,492 |
| Interquartile 75% (IQ3) | $48,614 | $48,494 |
| Interquartile Range (IQR) | $10,757 | $8,002 |
| Standard Deviation (Sample) | $8,036 | $7,633 |
| Standard Deviation (Population) | $8,009 | $7,598 |
Similar Demographics by Median Earnings
Demographics Similar to Immigrants by Median Earnings
In terms of median earnings, the demographic groups most similar to Immigrants are Scottish ($46,463, a difference of 0.030%), Kenyan ($46,462, a difference of 0.030%), Ghanaian ($46,440, a difference of 0.080%), Scandinavian ($46,433, a difference of 0.10%), and Immigrants from South America ($46,548, a difference of 0.15%).
| Demographics | Rating | Rank | Median Earnings |
| Icelanders | 66.3 /100 | #163 | Good $46,916 |
| Norwegians | 64.7 /100 | #164 | Good $46,865 |
| South Americans | 62.7 /100 | #165 | Good $46,804 |
| Czechoslovakians | 57.8 /100 | #166 | Average $46,658 |
| Costa Ricans | 57.4 /100 | #167 | Average $46,645 |
| Immigrants | Africa | 54.6 /100 | #168 | Average $46,564 |
| Immigrants | South America | 54.0 /100 | #169 | Average $46,548 |
| Immigrants | Immigrants | 51.6 /100 | #170 | Average $46,478 |
| Scottish | 51.1 /100 | #171 | Average $46,463 |
| Kenyans | 51.0 /100 | #172 | Average $46,462 |
| Ghanaians | 50.3 /100 | #173 | Average $46,440 |
| Scandinavians | 50.0 /100 | #174 | Average $46,433 |
| Basques | 48.8 /100 | #175 | Average $46,399 |
| Danes | 48.6 /100 | #176 | Average $46,392 |
| Belgians | 48.0 /100 | #177 | Average $46,375 |
Demographics Similar to Immigrants from Trinidad and Tobago by Median Earnings
In terms of median earnings, the demographic groups most similar to Immigrants from Trinidad and Tobago are Celtic ($45,732, a difference of 0.010%), Welsh ($45,710, a difference of 0.040%), Immigrants from Uruguay ($45,682, a difference of 0.10%), Tongan ($45,665, a difference of 0.14%), and Immigrants from the Azores ($45,812, a difference of 0.18%).
| Demographics | Rating | Rank | Median Earnings |
| Immigrants | St. Vincent and the Grenadines | 32.4 /100 | #195 | Fair $45,908 |
| Yugoslavians | 30.5 /100 | #196 | Fair $45,846 |
| Barbadians | 30.5 /100 | #197 | Fair $45,846 |
| Trinidadians and Tobagonians | 29.7 /100 | #198 | Fair $45,820 |
| Immigrants | Barbados | 29.6 /100 | #199 | Fair $45,816 |
| Immigrants | Azores | 29.5 /100 | #200 | Fair $45,812 |
| Celtics | 27.2 /100 | #201 | Fair $45,732 |
| Immigrants | Trinidad and Tobago | 27.1 /100 | #202 | Fair $45,729 |
| Welsh | 26.6 /100 | #203 | Fair $45,710 |
| Immigrants | Uruguay | 25.9 /100 | #204 | Fair $45,682 |
| Tongans | 25.4 /100 | #205 | Fair $45,665 |
| Immigrants | Ghana | 24.8 /100 | #206 | Fair $45,641 |
| Immigrants | Senegal | 24.0 /100 | #207 | Fair $45,611 |
| Immigrants | Bosnia and Herzegovina | 23.7 /100 | #208 | Fair $45,600 |
| Immigrants | Thailand | 23.7 /100 | #209 | Fair $45,598 |