Ecuadorian vs Immigrants from Trinidad and Tobago Median Earnings
COMPARE
Ecuadorian
Immigrants from Trinidad and Tobago
Median Earnings
Median Earnings Comparison
Ecuadorians
Immigrants from Trinidad and Tobago
$45,214
MEDIAN EARNINGS
15.3/ 100
METRIC RATING
220th/ 347
METRIC RANK
$45,729
MEDIAN EARNINGS
27.1/ 100
METRIC RATING
202nd/ 347
METRIC RANK
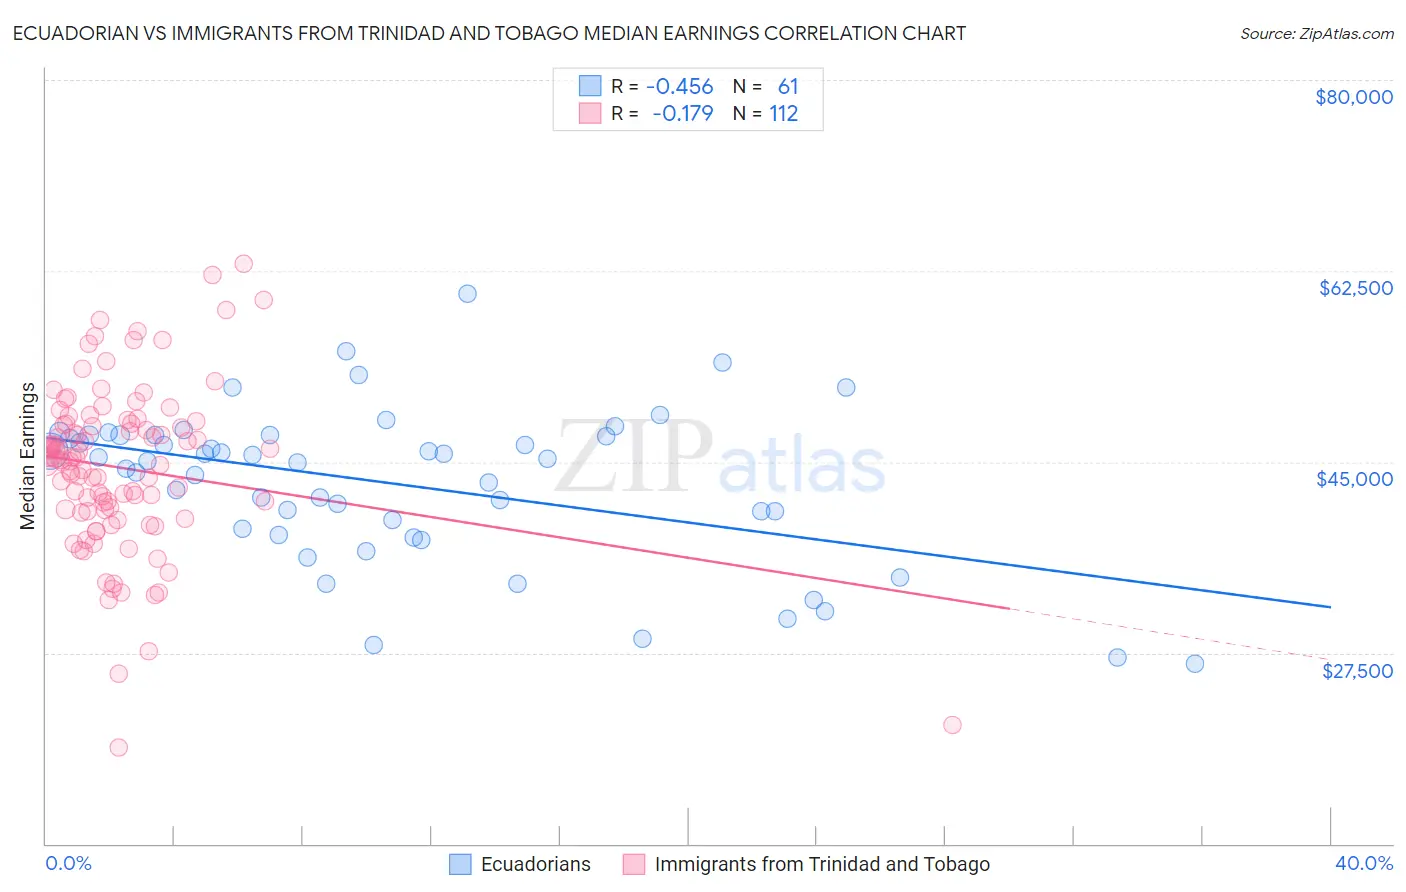
Ecuadorian vs Immigrants from Trinidad and Tobago Median Earnings Correlation Chart
The statistical analysis conducted on geographies consisting of 317,848,977 people shows a moderate negative correlation between the proportion of Ecuadorians and median earnings in the United States with a correlation coefficient (R) of -0.456 and weighted average of $45,214. Similarly, the statistical analysis conducted on geographies consisting of 223,533,236 people shows a poor negative correlation between the proportion of Immigrants from Trinidad and Tobago and median earnings in the United States with a correlation coefficient (R) of -0.179 and weighted average of $45,729, a difference of 1.1%.
Median Earnings Correlation Summary
| Measurement | Ecuadorian | Immigrants from Trinidad and Tobago |
| Minimum | $26,500 | $18,800 |
| Maximum | $60,377 | $63,173 |
| Range | $33,877 | $44,373 |
| Mean | $42,954 | $44,457 |
| Median | $45,047 | $45,233 |
| Interquartile 25% (IQ1) | $38,574 | $40,492 |
| Interquartile 75% (IQ3) | $47,434 | $48,494 |
| Interquartile Range (IQR) | $8,860 | $8,002 |
| Standard Deviation (Sample) | $7,114 | $7,633 |
| Standard Deviation (Population) | $7,055 | $7,598 |
Demographics Similar to Ecuadorians and Immigrants from Trinidad and Tobago by Median Earnings
In terms of median earnings, the demographic groups most similar to Ecuadorians are Immigrants from Guyana ($45,204, a difference of 0.020%), Dutch ($45,370, a difference of 0.35%), Spanish ($45,432, a difference of 0.48%), Tlingit-Haida ($45,468, a difference of 0.56%), and Guyanese ($45,470, a difference of 0.57%). Similarly, the demographic groups most similar to Immigrants from Trinidad and Tobago are Celtic ($45,732, a difference of 0.010%), Welsh ($45,710, a difference of 0.040%), Immigrants from Uruguay ($45,682, a difference of 0.10%), Tongan ($45,665, a difference of 0.14%), and Immigrants from Ghana ($45,641, a difference of 0.19%).
| Demographics | Rating | Rank | Median Earnings |
| Celtics | 27.2 /100 | #201 | Fair $45,732 |
| Immigrants | Trinidad and Tobago | 27.1 /100 | #202 | Fair $45,729 |
| Welsh | 26.6 /100 | #203 | Fair $45,710 |
| Immigrants | Uruguay | 25.9 /100 | #204 | Fair $45,682 |
| Tongans | 25.4 /100 | #205 | Fair $45,665 |
| Immigrants | Ghana | 24.8 /100 | #206 | Fair $45,641 |
| Immigrants | Senegal | 24.0 /100 | #207 | Fair $45,611 |
| Immigrants | Bosnia and Herzegovina | 23.7 /100 | #208 | Fair $45,600 |
| Immigrants | Thailand | 23.7 /100 | #209 | Fair $45,598 |
| Immigrants | Grenada | 23.6 /100 | #210 | Fair $45,596 |
| Panamanians | 23.5 /100 | #211 | Fair $45,593 |
| Bermudans | 23.5 /100 | #212 | Fair $45,593 |
| Immigrants | Colombia | 22.4 /100 | #213 | Fair $45,550 |
| Nigerians | 22.0 /100 | #214 | Fair $45,532 |
| Immigrants | Bangladesh | 22.0 /100 | #215 | Fair $45,532 |
| Guyanese | 20.6 /100 | #216 | Fair $45,470 |
| Tlingit-Haida | 20.5 /100 | #217 | Fair $45,468 |
| Spanish | 19.7 /100 | #218 | Poor $45,432 |
| Dutch | 18.4 /100 | #219 | Poor $45,370 |
| Ecuadorians | 15.3 /100 | #220 | Poor $45,214 |
| Immigrants | Guyana | 15.1 /100 | #221 | Poor $45,204 |