Serbian vs Immigrants from Trinidad and Tobago Professional Degree
COMPARE
Serbian
Immigrants from Trinidad and Tobago
Professional Degree
Professional Degree Comparison
Serbians
Immigrants from Trinidad and Tobago
4.8%
PROFESSIONAL DEGREE
92.6/ 100
METRIC RATING
127th/ 347
METRIC RANK
3.9%
PROFESSIONAL DEGREE
3.8/ 100
METRIC RATING
237th/ 347
METRIC RANK
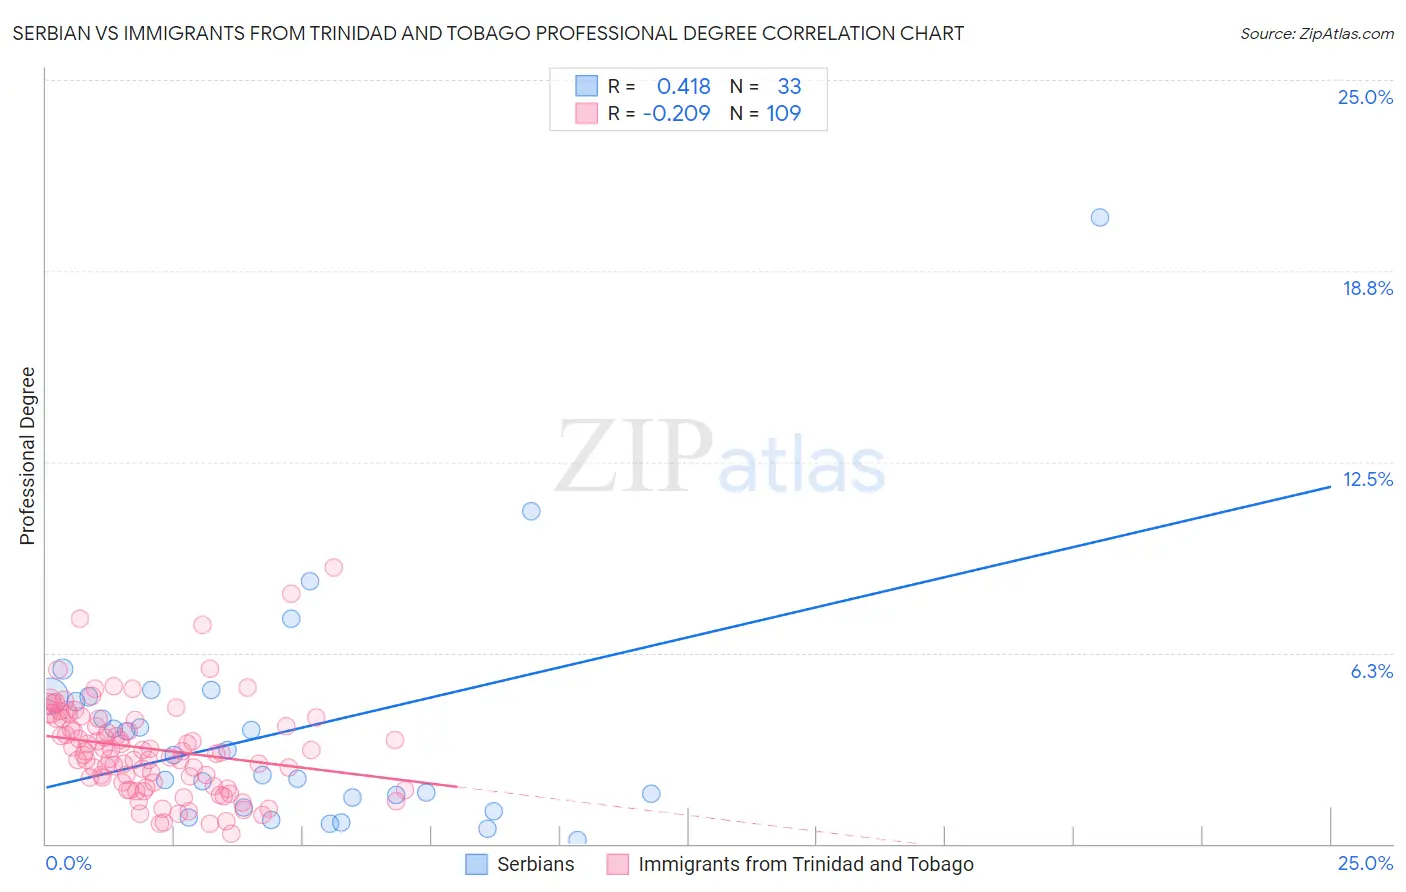
Serbian vs Immigrants from Trinidad and Tobago Professional Degree Correlation Chart
The statistical analysis conducted on geographies consisting of 267,248,415 people shows a moderate positive correlation between the proportion of Serbians and percentage of population with at least professional degree education in the United States with a correlation coefficient (R) of 0.418 and weighted average of 4.8%. Similarly, the statistical analysis conducted on geographies consisting of 223,309,655 people shows a weak negative correlation between the proportion of Immigrants from Trinidad and Tobago and percentage of population with at least professional degree education in the United States with a correlation coefficient (R) of -0.209 and weighted average of 3.9%, a difference of 23.7%.
Professional Degree Correlation Summary
| Measurement | Serbian | Immigrants from Trinidad and Tobago |
| Minimum | 0.11% | 0.34% |
| Maximum | 20.5% | 9.0% |
| Range | 20.4% | 8.7% |
| Mean | 3.7% | 3.1% |
| Median | 2.9% | 3.0% |
| Interquartile 25% (IQ1) | 1.4% | 1.9% |
| Interquartile 75% (IQ3) | 4.8% | 4.1% |
| Interquartile Range (IQR) | 3.5% | 2.2% |
| Standard Deviation (Sample) | 3.9% | 1.6% |
| Standard Deviation (Population) | 3.8% | 1.6% |
Similar Demographics by Professional Degree
Demographics Similar to Serbians by Professional Degree
In terms of professional degree, the demographic groups most similar to Serbians are Immigrants from Eastern Africa (4.8%, a difference of 0.020%), European (4.8%, a difference of 0.30%), Immigrants from Albania (4.8%, a difference of 0.35%), Immigrants from Eritrea (4.8%, a difference of 0.47%), and Palestinian (4.8%, a difference of 0.48%).
| Demographics | Rating | Rank | Professional Degree |
| Albanians | 95.3 /100 | #120 | Exceptional 4.9% |
| Immigrants | Moldova | 94.8 /100 | #121 | Exceptional 4.9% |
| Immigrants | Germany | 94.1 /100 | #122 | Exceptional 4.9% |
| Immigrants | Venezuela | 93.8 /100 | #123 | Exceptional 4.8% |
| Immigrants | Eritrea | 93.5 /100 | #124 | Exceptional 4.8% |
| Immigrants | Albania | 93.3 /100 | #125 | Exceptional 4.8% |
| Europeans | 93.2 /100 | #126 | Exceptional 4.8% |
| Serbians | 92.6 /100 | #127 | Exceptional 4.8% |
| Immigrants | Eastern Africa | 92.5 /100 | #128 | Exceptional 4.8% |
| Palestinians | 91.5 /100 | #129 | Exceptional 4.8% |
| Icelanders | 91.5 /100 | #130 | Exceptional 4.8% |
| Immigrants | Nepal | 91.4 /100 | #131 | Exceptional 4.8% |
| Pakistanis | 90.9 /100 | #132 | Exceptional 4.8% |
| Italians | 90.2 /100 | #133 | Exceptional 4.8% |
| South American Indians | 89.9 /100 | #134 | Excellent 4.8% |
Demographics Similar to Immigrants from Trinidad and Tobago by Professional Degree
In terms of professional degree, the demographic groups most similar to Immigrants from Trinidad and Tobago are Spanish American (3.9%, a difference of 0.070%), Immigrants from Barbados (3.9%, a difference of 0.29%), Nonimmigrants (3.9%, a difference of 0.30%), Immigrants from Philippines (3.9%, a difference of 0.34%), and Cree (3.9%, a difference of 0.60%).
| Demographics | Rating | Rank | Professional Degree |
| Nicaraguans | 5.1 /100 | #230 | Tragic 3.9% |
| Ecuadorians | 4.6 /100 | #231 | Tragic 3.9% |
| Cree | 4.3 /100 | #232 | Tragic 3.9% |
| Immigrants | Philippines | 4.1 /100 | #233 | Tragic 3.9% |
| Immigrants | Nonimmigrants | 4.0 /100 | #234 | Tragic 3.9% |
| Immigrants | Barbados | 4.0 /100 | #235 | Tragic 3.9% |
| Spanish Americans | 3.8 /100 | #236 | Tragic 3.9% |
| Immigrants | Trinidad and Tobago | 3.8 /100 | #237 | Tragic 3.9% |
| Colville | 2.6 /100 | #238 | Tragic 3.8% |
| British West Indians | 2.4 /100 | #239 | Tragic 3.8% |
| Immigrants | Ecuador | 2.3 /100 | #240 | Tragic 3.8% |
| Alaskan Athabascans | 2.3 /100 | #241 | Tragic 3.8% |
| Native Hawaiians | 2.3 /100 | #242 | Tragic 3.8% |
| Guamanians/Chamorros | 2.2 /100 | #243 | Tragic 3.8% |
| Immigrants | Bahamas | 2.0 /100 | #244 | Tragic 3.8% |