Serbian vs Immigrants from Trinidad and Tobago Median Family Income
COMPARE
Serbian
Immigrants from Trinidad and Tobago
Median Family Income
Median Family Income Comparison
Serbians
Immigrants from Trinidad and Tobago
$107,157
MEDIAN FAMILY INCOME
90.8/ 100
METRIC RATING
126th/ 347
METRIC RANK
$93,988
MEDIAN FAMILY INCOME
1.2/ 100
METRIC RATING
241st/ 347
METRIC RANK
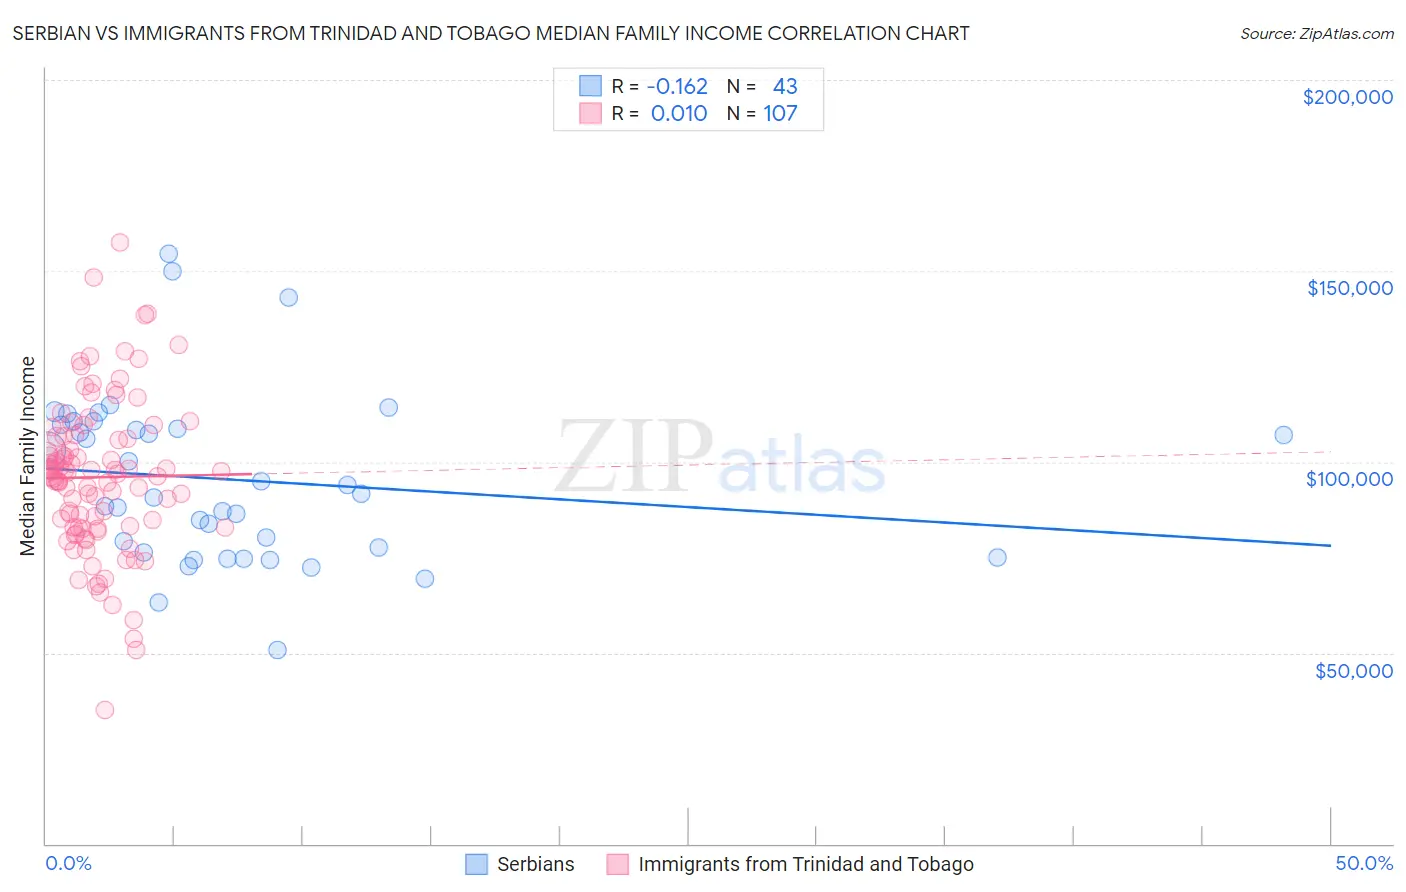
Serbian vs Immigrants from Trinidad and Tobago Median Family Income Correlation Chart
The statistical analysis conducted on geographies consisting of 267,482,647 people shows a poor negative correlation between the proportion of Serbians and median family income in the United States with a correlation coefficient (R) of -0.162 and weighted average of $107,157. Similarly, the statistical analysis conducted on geographies consisting of 223,463,571 people shows no correlation between the proportion of Immigrants from Trinidad and Tobago and median family income in the United States with a correlation coefficient (R) of 0.010 and weighted average of $93,988, a difference of 14.0%.
Median Family Income Correlation Summary
| Measurement | Serbian | Immigrants from Trinidad and Tobago |
| Minimum | $50,679 | $35,148 |
| Maximum | $154,464 | $157,500 |
| Range | $103,785 | $122,352 |
| Mean | $95,313 | $95,978 |
| Median | $91,648 | $96,780 |
| Interquartile 25% (IQ1) | $76,245 | $82,831 |
| Interquartile 75% (IQ3) | $109,780 | $106,554 |
| Interquartile Range (IQR) | $33,535 | $23,723 |
| Standard Deviation (Sample) | $22,166 | $20,068 |
| Standard Deviation (Population) | $21,907 | $19,974 |
Similar Demographics by Median Family Income
Demographics Similar to Serbians by Median Family Income
In terms of median family income, the demographic groups most similar to Serbians are Lebanese ($107,086, a difference of 0.070%), Taiwanese ($107,295, a difference of 0.13%), Immigrants from Ethiopia ($106,969, a difference of 0.18%), Arab ($106,952, a difference of 0.19%), and Brazilian ($106,942, a difference of 0.20%).
| Demographics | Rating | Rank | Median Family Income |
| Sri Lankans | 94.5 /100 | #119 | Exceptional $108,234 |
| Immigrants | Northern Africa | 94.3 /100 | #120 | Exceptional $108,161 |
| Europeans | 94.1 /100 | #121 | Exceptional $108,099 |
| Immigrants | Jordan | 92.9 /100 | #122 | Exceptional $107,715 |
| Carpatho Rusyns | 92.2 /100 | #123 | Exceptional $107,502 |
| Pakistanis | 91.7 /100 | #124 | Exceptional $107,390 |
| Taiwanese | 91.4 /100 | #125 | Exceptional $107,295 |
| Serbians | 90.8 /100 | #126 | Exceptional $107,157 |
| Lebanese | 90.5 /100 | #127 | Exceptional $107,086 |
| Immigrants | Ethiopia | 90.0 /100 | #128 | Excellent $106,969 |
| Arabs | 89.9 /100 | #129 | Excellent $106,952 |
| Brazilians | 89.8 /100 | #130 | Excellent $106,942 |
| Canadians | 88.1 /100 | #131 | Excellent $106,597 |
| Immigrants | Fiji | 87.8 /100 | #132 | Excellent $106,544 |
| Ugandans | 87.8 /100 | #133 | Excellent $106,541 |
Demographics Similar to Immigrants from Trinidad and Tobago by Median Family Income
In terms of median family income, the demographic groups most similar to Immigrants from Trinidad and Tobago are Barbadian ($93,919, a difference of 0.070%), Somali ($94,085, a difference of 0.10%), Salvadoran ($94,109, a difference of 0.13%), German Russian ($93,858, a difference of 0.14%), and Nepalese ($94,153, a difference of 0.17%).
| Demographics | Rating | Rank | Median Family Income |
| Immigrants | Western Africa | 1.6 /100 | #234 | Tragic $94,638 |
| Immigrants | Burma/Myanmar | 1.5 /100 | #235 | Tragic $94,472 |
| Trinidadians and Tobagonians | 1.5 /100 | #236 | Tragic $94,466 |
| Alaskan Athabascans | 1.5 /100 | #237 | Tragic $94,429 |
| Nepalese | 1.3 /100 | #238 | Tragic $94,153 |
| Salvadorans | 1.2 /100 | #239 | Tragic $94,109 |
| Somalis | 1.2 /100 | #240 | Tragic $94,085 |
| Immigrants | Trinidad and Tobago | 1.2 /100 | #241 | Tragic $93,988 |
| Barbadians | 1.1 /100 | #242 | Tragic $93,919 |
| German Russians | 1.1 /100 | #243 | Tragic $93,858 |
| Sub-Saharan Africans | 1.0 /100 | #244 | Tragic $93,748 |
| Immigrants | Middle Africa | 1.0 /100 | #245 | Tragic $93,593 |
| Guyanese | 0.9 /100 | #246 | Tragic $93,373 |
| Immigrants | Senegal | 0.7 /100 | #247 | Tragic $92,912 |
| French American Indians | 0.7 /100 | #248 | Tragic $92,872 |