Serbian vs Colville Median Earnings
COMPARE
Serbian
Colville
Median Earnings
Median Earnings Comparison
Serbians
Colville
$48,677
MEDIAN EARNINGS
95.9/ 100
METRIC RATING
117th/ 347
METRIC RANK
$42,151
MEDIAN EARNINGS
0.2/ 100
METRIC RATING
279th/ 347
METRIC RANK
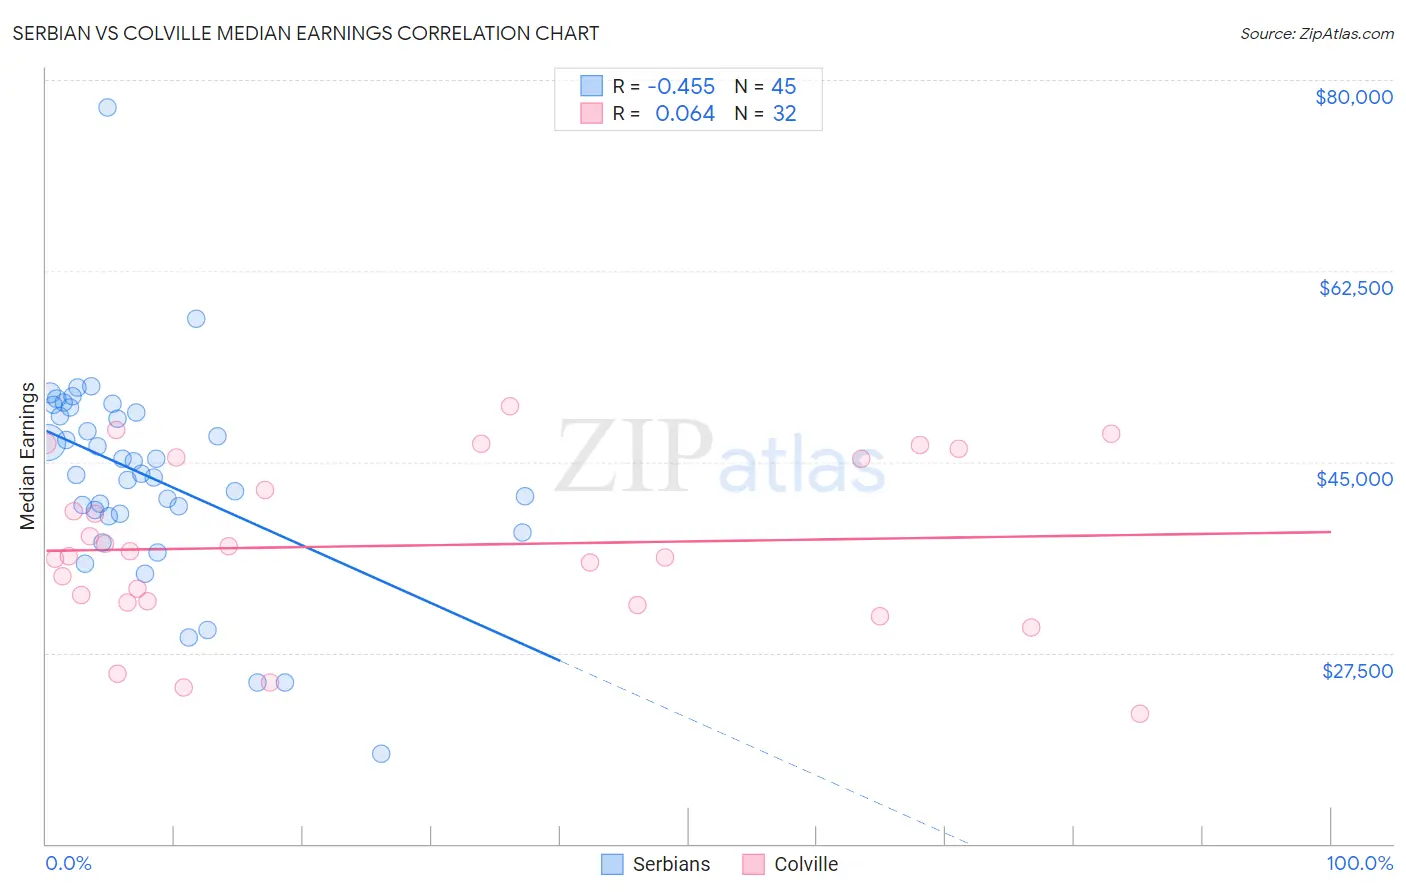
Serbian vs Colville Median Earnings Correlation Chart
The statistical analysis conducted on geographies consisting of 267,654,810 people shows a moderate negative correlation between the proportion of Serbians and median earnings in the United States with a correlation coefficient (R) of -0.455 and weighted average of $48,677. Similarly, the statistical analysis conducted on geographies consisting of 34,684,676 people shows a slight positive correlation between the proportion of Colville and median earnings in the United States with a correlation coefficient (R) of 0.064 and weighted average of $42,151, a difference of 15.5%.
Median Earnings Correlation Summary
| Measurement | Serbian | Colville |
| Minimum | $18,250 | $21,944 |
| Maximum | $77,452 | $50,045 |
| Range | $59,202 | $28,101 |
| Mean | $43,689 | $37,312 |
| Median | $43,879 | $36,531 |
| Interquartile 25% (IQ1) | $40,125 | $32,193 |
| Interquartile 75% (IQ3) | $49,731 | $45,323 |
| Interquartile Range (IQR) | $9,606 | $13,130 |
| Standard Deviation (Sample) | $9,625 | $7,666 |
| Standard Deviation (Population) | $9,517 | $7,545 |
Similar Demographics by Median Earnings
Demographics Similar to Serbians by Median Earnings
In terms of median earnings, the demographic groups most similar to Serbians are Immigrants from Jordan ($48,673, a difference of 0.010%), Polish ($48,659, a difference of 0.040%), Korean ($48,727, a difference of 0.10%), Carpatho Rusyn ($48,617, a difference of 0.12%), and Arab ($48,599, a difference of 0.16%).
| Demographics | Rating | Rank | Median Earnings |
| Immigrants | Ethiopia | 97.1 /100 | #110 | Exceptional $48,924 |
| Immigrants | Zimbabwe | 97.0 /100 | #111 | Exceptional $48,913 |
| Northern Europeans | 96.9 /100 | #112 | Exceptional $48,887 |
| Immigrants | Kuwait | 96.8 /100 | #113 | Exceptional $48,861 |
| Moroccans | 96.7 /100 | #114 | Exceptional $48,838 |
| Chinese | 96.7 /100 | #115 | Exceptional $48,836 |
| Koreans | 96.2 /100 | #116 | Exceptional $48,727 |
| Serbians | 95.9 /100 | #117 | Exceptional $48,677 |
| Immigrants | Jordan | 95.9 /100 | #118 | Exceptional $48,673 |
| Poles | 95.8 /100 | #119 | Exceptional $48,659 |
| Carpatho Rusyns | 95.5 /100 | #120 | Exceptional $48,617 |
| Arabs | 95.4 /100 | #121 | Exceptional $48,599 |
| Chileans | 94.8 /100 | #122 | Exceptional $48,504 |
| Immigrants | Syria | 93.9 /100 | #123 | Exceptional $48,375 |
| Brazilians | 93.7 /100 | #124 | Exceptional $48,356 |
Demographics Similar to Colville by Median Earnings
In terms of median earnings, the demographic groups most similar to Colville are Cajun ($42,189, a difference of 0.090%), Hmong ($42,111, a difference of 0.10%), Central American ($42,280, a difference of 0.31%), Spanish American ($42,316, a difference of 0.39%), and Marshallese ($41,969, a difference of 0.43%).
| Demographics | Rating | Rank | Median Earnings |
| Iroquois | 0.4 /100 | #272 | Tragic $42,430 |
| Immigrants | Dominica | 0.4 /100 | #273 | Tragic $42,420 |
| Immigrants | El Salvador | 0.4 /100 | #274 | Tragic $42,413 |
| Immigrants | Belize | 0.3 /100 | #275 | Tragic $42,339 |
| Spanish Americans | 0.3 /100 | #276 | Tragic $42,316 |
| Central Americans | 0.3 /100 | #277 | Tragic $42,280 |
| Cajuns | 0.3 /100 | #278 | Tragic $42,189 |
| Colville | 0.2 /100 | #279 | Tragic $42,151 |
| Hmong | 0.2 /100 | #280 | Tragic $42,111 |
| Marshallese | 0.2 /100 | #281 | Tragic $41,969 |
| Africans | 0.2 /100 | #282 | Tragic $41,955 |
| Dominicans | 0.2 /100 | #283 | Tragic $41,864 |
| Blackfeet | 0.2 /100 | #284 | Tragic $41,822 |
| Immigrants | Nicaragua | 0.1 /100 | #285 | Tragic $41,737 |
| Mexican American Indians | 0.1 /100 | #286 | Tragic $41,719 |