Cambodian vs Immigrants from Trinidad and Tobago Median Earnings
COMPARE
Cambodian
Immigrants from Trinidad and Tobago
Median Earnings
Median Earnings Comparison
Cambodians
Immigrants from Trinidad and Tobago
$53,386
MEDIAN EARNINGS
100.0/ 100
METRIC RATING
30th/ 347
METRIC RANK
$45,729
MEDIAN EARNINGS
27.1/ 100
METRIC RATING
202nd/ 347
METRIC RANK
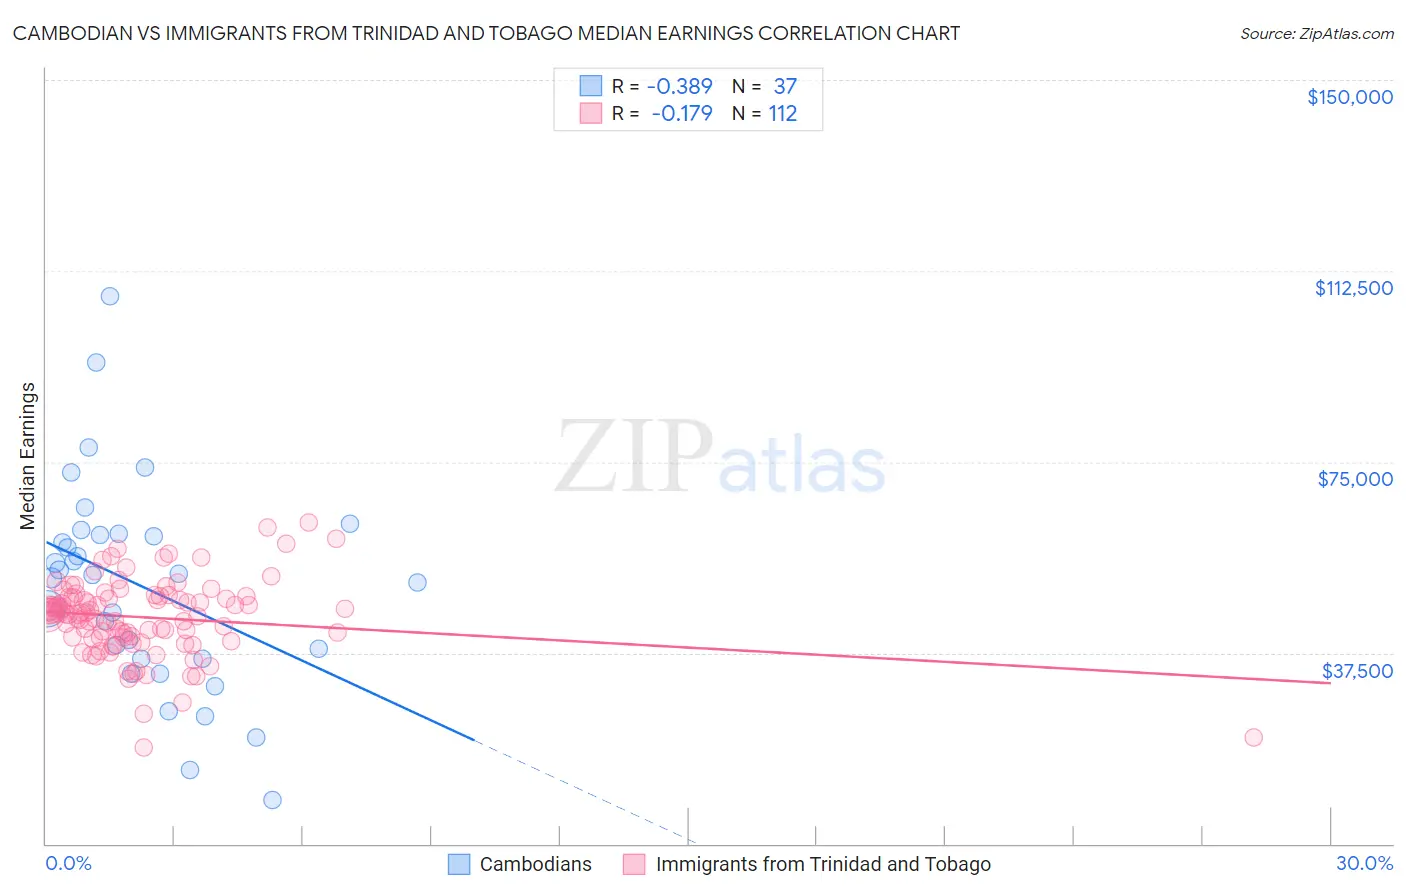
Cambodian vs Immigrants from Trinidad and Tobago Median Earnings Correlation Chart
The statistical analysis conducted on geographies consisting of 102,521,064 people shows a mild negative correlation between the proportion of Cambodians and median earnings in the United States with a correlation coefficient (R) of -0.389 and weighted average of $53,386. Similarly, the statistical analysis conducted on geographies consisting of 223,533,236 people shows a poor negative correlation between the proportion of Immigrants from Trinidad and Tobago and median earnings in the United States with a correlation coefficient (R) of -0.179 and weighted average of $45,729, a difference of 16.7%.
Median Earnings Correlation Summary
| Measurement | Cambodian | Immigrants from Trinidad and Tobago |
| Minimum | $8,623 | $18,800 |
| Maximum | $107,569 | $63,173 |
| Range | $98,946 | $44,373 |
| Mean | $50,400 | $44,457 |
| Median | $52,839 | $45,233 |
| Interquartile 25% (IQ1) | $36,414 | $40,492 |
| Interquartile 75% (IQ3) | $60,699 | $48,494 |
| Interquartile Range (IQR) | $24,284 | $8,002 |
| Standard Deviation (Sample) | $20,473 | $7,633 |
| Standard Deviation (Population) | $20,194 | $7,598 |
Similar Demographics by Median Earnings
Demographics Similar to Cambodians by Median Earnings
In terms of median earnings, the demographic groups most similar to Cambodians are Russian ($53,334, a difference of 0.10%), Immigrants from Russia ($53,457, a difference of 0.13%), Immigrants from Asia ($53,310, a difference of 0.14%), Immigrants from Greece ($53,282, a difference of 0.19%), and Immigrants from France ($53,490, a difference of 0.20%).
| Demographics | Rating | Rank | Median Earnings |
| Immigrants | Sweden | 100.0 /100 | #23 | Exceptional $54,478 |
| Soviet Union | 100.0 /100 | #24 | Exceptional $54,290 |
| Turks | 100.0 /100 | #25 | Exceptional $53,919 |
| Immigrants | Northern Europe | 100.0 /100 | #26 | Exceptional $53,872 |
| Asians | 100.0 /100 | #27 | Exceptional $53,690 |
| Immigrants | France | 100.0 /100 | #28 | Exceptional $53,490 |
| Immigrants | Russia | 100.0 /100 | #29 | Exceptional $53,457 |
| Cambodians | 100.0 /100 | #30 | Exceptional $53,386 |
| Russians | 100.0 /100 | #31 | Exceptional $53,334 |
| Immigrants | Asia | 100.0 /100 | #32 | Exceptional $53,310 |
| Immigrants | Greece | 100.0 /100 | #33 | Exceptional $53,282 |
| Immigrants | Sri Lanka | 100.0 /100 | #34 | Exceptional $53,268 |
| Immigrants | Switzerland | 100.0 /100 | #35 | Exceptional $53,211 |
| Immigrants | Denmark | 100.0 /100 | #36 | Exceptional $53,186 |
| Immigrants | Belarus | 100.0 /100 | #37 | Exceptional $53,043 |
Demographics Similar to Immigrants from Trinidad and Tobago by Median Earnings
In terms of median earnings, the demographic groups most similar to Immigrants from Trinidad and Tobago are Celtic ($45,732, a difference of 0.010%), Welsh ($45,710, a difference of 0.040%), Immigrants from Uruguay ($45,682, a difference of 0.10%), Tongan ($45,665, a difference of 0.14%), and Immigrants from the Azores ($45,812, a difference of 0.18%).
| Demographics | Rating | Rank | Median Earnings |
| Immigrants | St. Vincent and the Grenadines | 32.4 /100 | #195 | Fair $45,908 |
| Yugoslavians | 30.5 /100 | #196 | Fair $45,846 |
| Barbadians | 30.5 /100 | #197 | Fair $45,846 |
| Trinidadians and Tobagonians | 29.7 /100 | #198 | Fair $45,820 |
| Immigrants | Barbados | 29.6 /100 | #199 | Fair $45,816 |
| Immigrants | Azores | 29.5 /100 | #200 | Fair $45,812 |
| Celtics | 27.2 /100 | #201 | Fair $45,732 |
| Immigrants | Trinidad and Tobago | 27.1 /100 | #202 | Fair $45,729 |
| Welsh | 26.6 /100 | #203 | Fair $45,710 |
| Immigrants | Uruguay | 25.9 /100 | #204 | Fair $45,682 |
| Tongans | 25.4 /100 | #205 | Fair $45,665 |
| Immigrants | Ghana | 24.8 /100 | #206 | Fair $45,641 |
| Immigrants | Senegal | 24.0 /100 | #207 | Fair $45,611 |
| Immigrants | Bosnia and Herzegovina | 23.7 /100 | #208 | Fair $45,600 |
| Immigrants | Thailand | 23.7 /100 | #209 | Fair $45,598 |