Serbian vs Immigrants from Nepal Median Earnings
COMPARE
Serbian
Immigrants from Nepal
Median Earnings
Median Earnings Comparison
Serbians
Immigrants from Nepal
$48,677
MEDIAN EARNINGS
95.9/ 100
METRIC RATING
117th/ 347
METRIC RANK
$47,925
MEDIAN EARNINGS
89.0/ 100
METRIC RATING
137th/ 347
METRIC RANK
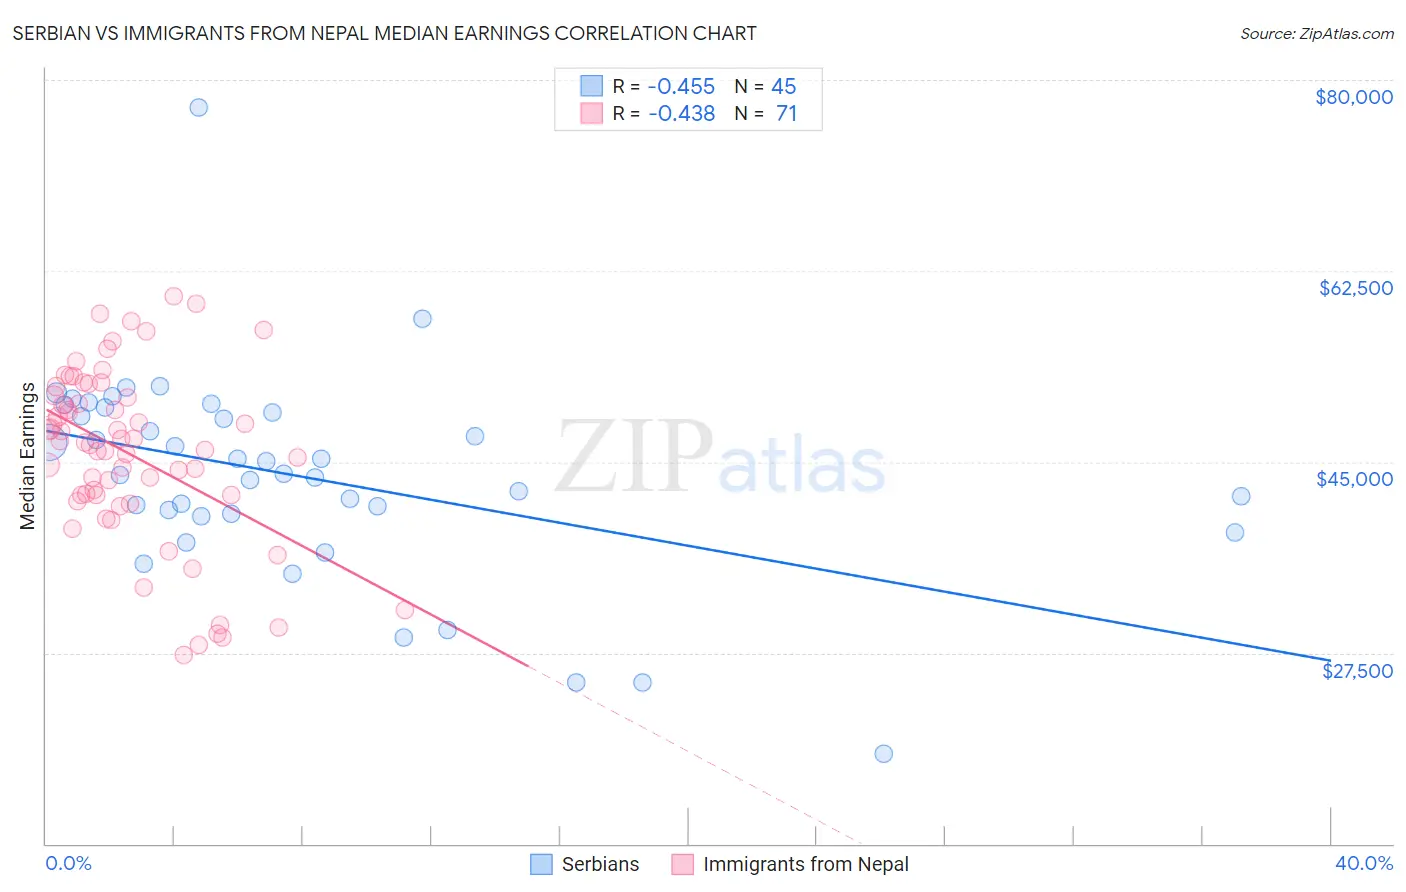
Serbian vs Immigrants from Nepal Median Earnings Correlation Chart
The statistical analysis conducted on geographies consisting of 267,654,810 people shows a moderate negative correlation between the proportion of Serbians and median earnings in the United States with a correlation coefficient (R) of -0.455 and weighted average of $48,677. Similarly, the statistical analysis conducted on geographies consisting of 186,786,511 people shows a moderate negative correlation between the proportion of Immigrants from Nepal and median earnings in the United States with a correlation coefficient (R) of -0.438 and weighted average of $47,925, a difference of 1.6%.
Median Earnings Correlation Summary
| Measurement | Serbian | Immigrants from Nepal |
| Minimum | $18,250 | $27,307 |
| Maximum | $77,452 | $60,227 |
| Range | $59,202 | $32,920 |
| Mean | $43,689 | $45,713 |
| Median | $43,879 | $46,771 |
| Interquartile 25% (IQ1) | $40,125 | $41,930 |
| Interquartile 75% (IQ3) | $49,731 | $51,099 |
| Interquartile Range (IQR) | $9,606 | $9,169 |
| Standard Deviation (Sample) | $9,625 | $7,950 |
| Standard Deviation (Population) | $9,517 | $7,894 |
Demographics Similar to Serbians and Immigrants from Nepal by Median Earnings
In terms of median earnings, the demographic groups most similar to Serbians are Immigrants from Jordan ($48,673, a difference of 0.010%), Polish ($48,659, a difference of 0.040%), Carpatho Rusyn ($48,617, a difference of 0.12%), Arab ($48,599, a difference of 0.16%), and Chilean ($48,504, a difference of 0.36%). Similarly, the demographic groups most similar to Immigrants from Nepal are Slovene ($47,995, a difference of 0.15%), Portuguese ($48,032, a difference of 0.22%), Immigrants from Uganda ($48,041, a difference of 0.24%), Sri Lankan ($48,040, a difference of 0.24%), and British ($48,189, a difference of 0.55%).
| Demographics | Rating | Rank | Median Earnings |
| Serbians | 95.9 /100 | #117 | Exceptional $48,677 |
| Immigrants | Jordan | 95.9 /100 | #118 | Exceptional $48,673 |
| Poles | 95.8 /100 | #119 | Exceptional $48,659 |
| Carpatho Rusyns | 95.5 /100 | #120 | Exceptional $48,617 |
| Arabs | 95.4 /100 | #121 | Exceptional $48,599 |
| Chileans | 94.8 /100 | #122 | Exceptional $48,504 |
| Immigrants | Syria | 93.9 /100 | #123 | Exceptional $48,375 |
| Brazilians | 93.7 /100 | #124 | Exceptional $48,356 |
| Immigrants | Fiji | 93.3 /100 | #125 | Exceptional $48,305 |
| Assyrians/Chaldeans/Syriacs | 93.3 /100 | #126 | Exceptional $48,304 |
| Sierra Leoneans | 93.1 /100 | #127 | Exceptional $48,286 |
| Immigrants | Philippines | 92.9 /100 | #128 | Exceptional $48,266 |
| Pakistanis | 92.8 /100 | #129 | Exceptional $48,254 |
| Zimbabweans | 92.6 /100 | #130 | Exceptional $48,229 |
| Lebanese | 92.5 /100 | #131 | Exceptional $48,226 |
| British | 92.2 /100 | #132 | Exceptional $48,189 |
| Immigrants | Uganda | 90.5 /100 | #133 | Exceptional $48,041 |
| Sri Lankans | 90.5 /100 | #134 | Exceptional $48,040 |
| Portuguese | 90.4 /100 | #135 | Exceptional $48,032 |
| Slovenes | 90.0 /100 | #136 | Excellent $47,995 |
| Immigrants | Nepal | 89.0 /100 | #137 | Excellent $47,925 |