Cape Verdean vs Immigrants from Trinidad and Tobago Median Earnings
COMPARE
Cape Verdean
Immigrants from Trinidad and Tobago
Median Earnings
Median Earnings Comparison
Cape Verdeans
Immigrants from Trinidad and Tobago
$44,640
MEDIAN EARNINGS
7.5/ 100
METRIC RATING
234th/ 347
METRIC RANK
$45,729
MEDIAN EARNINGS
27.1/ 100
METRIC RATING
202nd/ 347
METRIC RANK
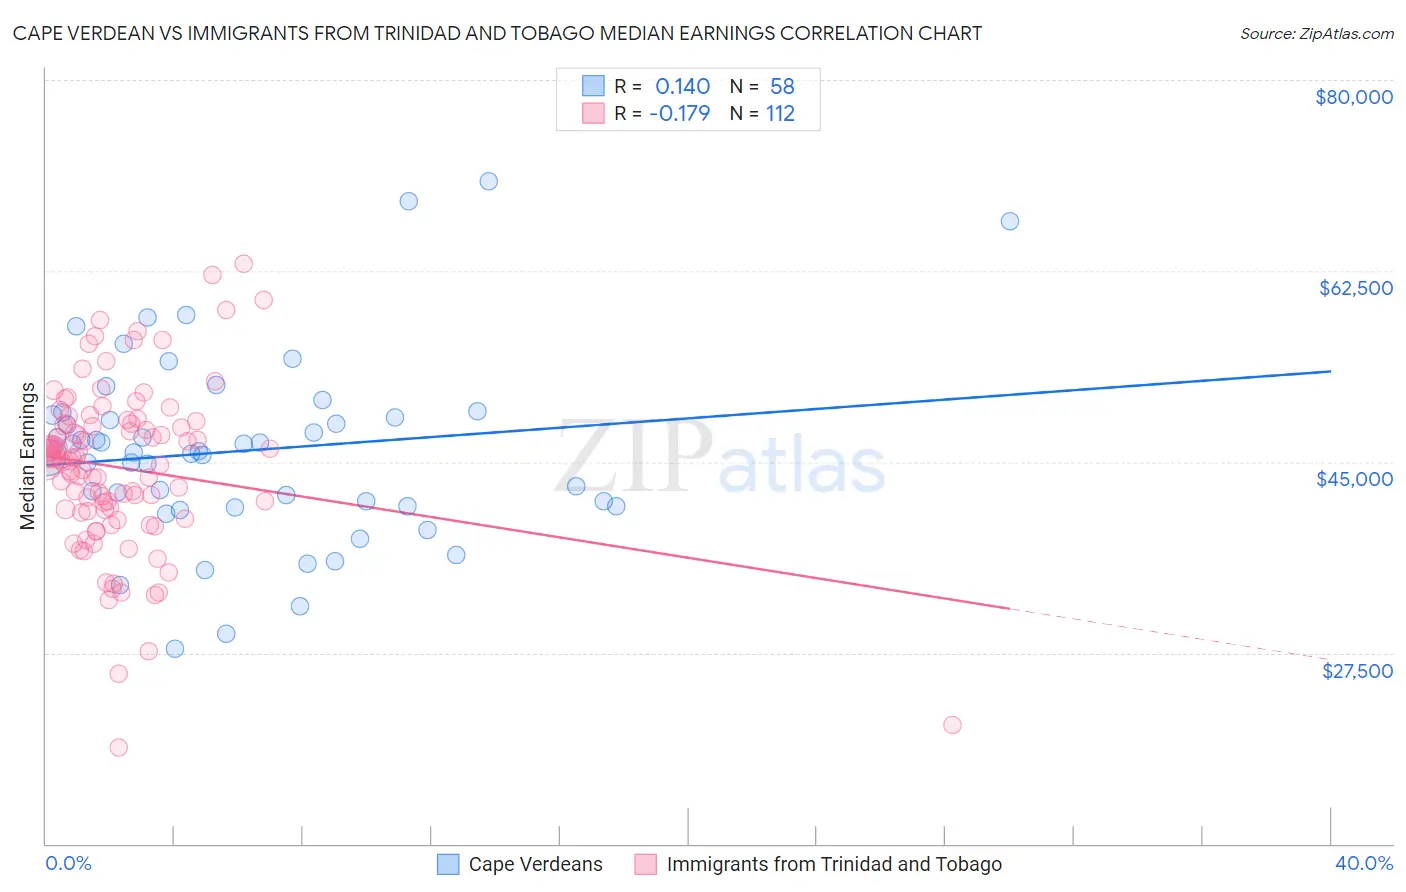
Cape Verdean vs Immigrants from Trinidad and Tobago Median Earnings Correlation Chart
The statistical analysis conducted on geographies consisting of 107,579,856 people shows a poor positive correlation between the proportion of Cape Verdeans and median earnings in the United States with a correlation coefficient (R) of 0.140 and weighted average of $44,640. Similarly, the statistical analysis conducted on geographies consisting of 223,533,236 people shows a poor negative correlation between the proportion of Immigrants from Trinidad and Tobago and median earnings in the United States with a correlation coefficient (R) of -0.179 and weighted average of $45,729, a difference of 2.4%.
Median Earnings Correlation Summary
| Measurement | Cape Verdean | Immigrants from Trinidad and Tobago |
| Minimum | $27,841 | $18,800 |
| Maximum | $70,758 | $63,173 |
| Range | $42,917 | $44,373 |
| Mean | $46,038 | $44,457 |
| Median | $45,876 | $45,233 |
| Interquartile 25% (IQ1) | $40,962 | $40,492 |
| Interquartile 75% (IQ3) | $49,336 | $48,494 |
| Interquartile Range (IQR) | $8,374 | $8,002 |
| Standard Deviation (Sample) | $8,551 | $7,633 |
| Standard Deviation (Population) | $8,477 | $7,598 |
Similar Demographics by Median Earnings
Demographics Similar to Cape Verdeans by Median Earnings
In terms of median earnings, the demographic groups most similar to Cape Verdeans are Venezuelan ($44,580, a difference of 0.14%), British West Indian ($44,552, a difference of 0.20%), Immigrants from Sudan ($44,767, a difference of 0.28%), Delaware ($44,783, a difference of 0.32%), and Immigrants from Ecuador ($44,462, a difference of 0.40%).
| Demographics | Rating | Rank | Median Earnings |
| Native Hawaiians | 12.2 /100 | #227 | Poor $45,027 |
| Immigrants | Iraq | 11.6 /100 | #228 | Poor $44,988 |
| Scotch-Irish | 10.7 /100 | #229 | Poor $44,924 |
| Immigrants | Western Africa | 10.3 /100 | #230 | Poor $44,893 |
| Japanese | 9.5 /100 | #231 | Tragic $44,825 |
| Delaware | 9.0 /100 | #232 | Tragic $44,783 |
| Immigrants | Sudan | 8.8 /100 | #233 | Tragic $44,767 |
| Cape Verdeans | 7.5 /100 | #234 | Tragic $44,640 |
| Venezuelans | 6.9 /100 | #235 | Tragic $44,580 |
| British West Indians | 6.7 /100 | #236 | Tragic $44,552 |
| Immigrants | Ecuador | 5.9 /100 | #237 | Tragic $44,462 |
| Sudanese | 5.6 /100 | #238 | Tragic $44,419 |
| Senegalese | 5.3 /100 | #239 | Tragic $44,373 |
| Aleuts | 4.4 /100 | #240 | Tragic $44,241 |
| Samoans | 4.2 /100 | #241 | Tragic $44,206 |
Demographics Similar to Immigrants from Trinidad and Tobago by Median Earnings
In terms of median earnings, the demographic groups most similar to Immigrants from Trinidad and Tobago are Celtic ($45,732, a difference of 0.010%), Welsh ($45,710, a difference of 0.040%), Immigrants from Uruguay ($45,682, a difference of 0.10%), Tongan ($45,665, a difference of 0.14%), and Immigrants from the Azores ($45,812, a difference of 0.18%).
| Demographics | Rating | Rank | Median Earnings |
| Immigrants | St. Vincent and the Grenadines | 32.4 /100 | #195 | Fair $45,908 |
| Yugoslavians | 30.5 /100 | #196 | Fair $45,846 |
| Barbadians | 30.5 /100 | #197 | Fair $45,846 |
| Trinidadians and Tobagonians | 29.7 /100 | #198 | Fair $45,820 |
| Immigrants | Barbados | 29.6 /100 | #199 | Fair $45,816 |
| Immigrants | Azores | 29.5 /100 | #200 | Fair $45,812 |
| Celtics | 27.2 /100 | #201 | Fair $45,732 |
| Immigrants | Trinidad and Tobago | 27.1 /100 | #202 | Fair $45,729 |
| Welsh | 26.6 /100 | #203 | Fair $45,710 |
| Immigrants | Uruguay | 25.9 /100 | #204 | Fair $45,682 |
| Tongans | 25.4 /100 | #205 | Fair $45,665 |
| Immigrants | Ghana | 24.8 /100 | #206 | Fair $45,641 |
| Immigrants | Senegal | 24.0 /100 | #207 | Fair $45,611 |
| Immigrants | Bosnia and Herzegovina | 23.7 /100 | #208 | Fair $45,600 |
| Immigrants | Thailand | 23.7 /100 | #209 | Fair $45,598 |