Immigrants from Panama vs Immigrants from Trinidad and Tobago Median Earnings
COMPARE
Immigrants from Panama
Immigrants from Trinidad and Tobago
Median Earnings
Median Earnings Comparison
Immigrants from Panama
Immigrants from Trinidad and Tobago
$45,198
MEDIAN EARNINGS
15.0/ 100
METRIC RATING
222nd/ 347
METRIC RANK
$45,729
MEDIAN EARNINGS
27.1/ 100
METRIC RATING
202nd/ 347
METRIC RANK
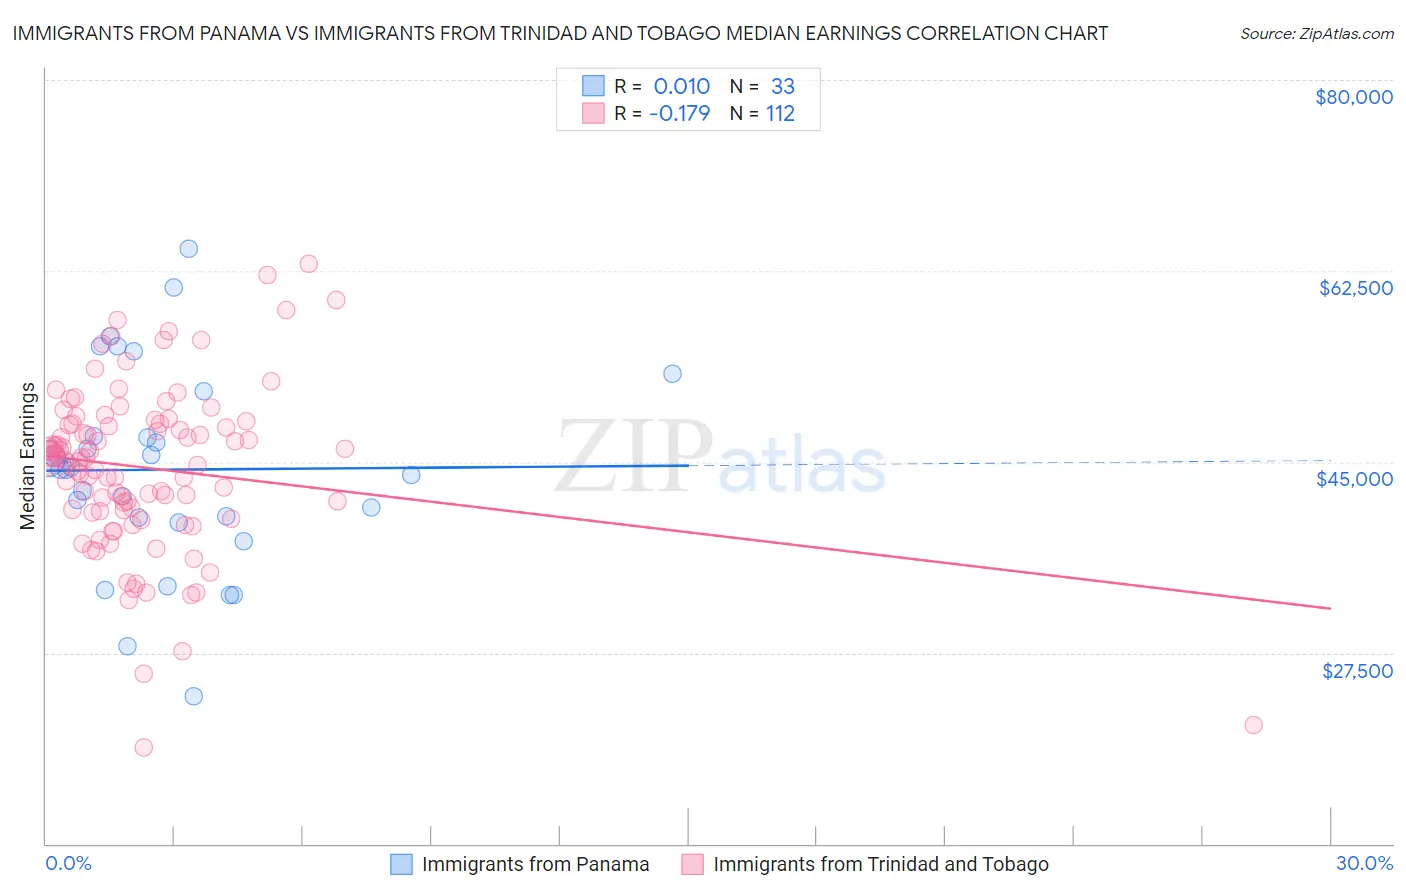
Immigrants from Panama vs Immigrants from Trinidad and Tobago Median Earnings Correlation Chart
The statistical analysis conducted on geographies consisting of 221,169,853 people shows no correlation between the proportion of Immigrants from Panama and median earnings in the United States with a correlation coefficient (R) of 0.010 and weighted average of $45,198. Similarly, the statistical analysis conducted on geographies consisting of 223,533,236 people shows a poor negative correlation between the proportion of Immigrants from Trinidad and Tobago and median earnings in the United States with a correlation coefficient (R) of -0.179 and weighted average of $45,729, a difference of 1.2%.
Median Earnings Correlation Summary
| Measurement | Immigrants from Panama | Immigrants from Trinidad and Tobago |
| Minimum | $23,516 | $18,800 |
| Maximum | $64,519 | $63,173 |
| Range | $41,003 | $44,373 |
| Mean | $44,283 | $44,457 |
| Median | $44,355 | $45,233 |
| Interquartile 25% (IQ1) | $39,682 | $40,492 |
| Interquartile 75% (IQ3) | $49,375 | $48,494 |
| Interquartile Range (IQR) | $9,693 | $8,002 |
| Standard Deviation (Sample) | $9,181 | $7,633 |
| Standard Deviation (Population) | $9,041 | $7,598 |
Demographics Similar to Immigrants from Panama and Immigrants from Trinidad and Tobago by Median Earnings
In terms of median earnings, the demographic groups most similar to Immigrants from Panama are Immigrants from Guyana ($45,204, a difference of 0.010%), Ecuadorian ($45,214, a difference of 0.030%), Dutch ($45,370, a difference of 0.38%), Spanish ($45,432, a difference of 0.52%), and Guyanese ($45,470, a difference of 0.60%). Similarly, the demographic groups most similar to Immigrants from Trinidad and Tobago are Welsh ($45,710, a difference of 0.040%), Immigrants from Uruguay ($45,682, a difference of 0.10%), Tongan ($45,665, a difference of 0.14%), Immigrants from Ghana ($45,641, a difference of 0.19%), and Immigrants from Senegal ($45,611, a difference of 0.26%).
| Demographics | Rating | Rank | Median Earnings |
| Immigrants | Trinidad and Tobago | 27.1 /100 | #202 | Fair $45,729 |
| Welsh | 26.6 /100 | #203 | Fair $45,710 |
| Immigrants | Uruguay | 25.9 /100 | #204 | Fair $45,682 |
| Tongans | 25.4 /100 | #205 | Fair $45,665 |
| Immigrants | Ghana | 24.8 /100 | #206 | Fair $45,641 |
| Immigrants | Senegal | 24.0 /100 | #207 | Fair $45,611 |
| Immigrants | Bosnia and Herzegovina | 23.7 /100 | #208 | Fair $45,600 |
| Immigrants | Thailand | 23.7 /100 | #209 | Fair $45,598 |
| Immigrants | Grenada | 23.6 /100 | #210 | Fair $45,596 |
| Panamanians | 23.5 /100 | #211 | Fair $45,593 |
| Bermudans | 23.5 /100 | #212 | Fair $45,593 |
| Immigrants | Colombia | 22.4 /100 | #213 | Fair $45,550 |
| Nigerians | 22.0 /100 | #214 | Fair $45,532 |
| Immigrants | Bangladesh | 22.0 /100 | #215 | Fair $45,532 |
| Guyanese | 20.6 /100 | #216 | Fair $45,470 |
| Tlingit-Haida | 20.5 /100 | #217 | Fair $45,468 |
| Spanish | 19.7 /100 | #218 | Poor $45,432 |
| Dutch | 18.4 /100 | #219 | Poor $45,370 |
| Ecuadorians | 15.3 /100 | #220 | Poor $45,214 |
| Immigrants | Guyana | 15.1 /100 | #221 | Poor $45,204 |
| Immigrants | Panama | 15.0 /100 | #222 | Poor $45,198 |