Immigrants from Ireland vs Immigrants from Netherlands Median Family Income
COMPARE
Immigrants from Ireland
Immigrants from Netherlands
Median Family Income
Median Family Income Comparison
Immigrants from Ireland
Immigrants from Netherlands
$127,584
MEDIAN FAMILY INCOME
100.0/ 100
METRIC RATING
10th/ 347
METRIC RANK
$114,987
MEDIAN FAMILY INCOME
99.8/ 100
METRIC RATING
59th/ 347
METRIC RANK
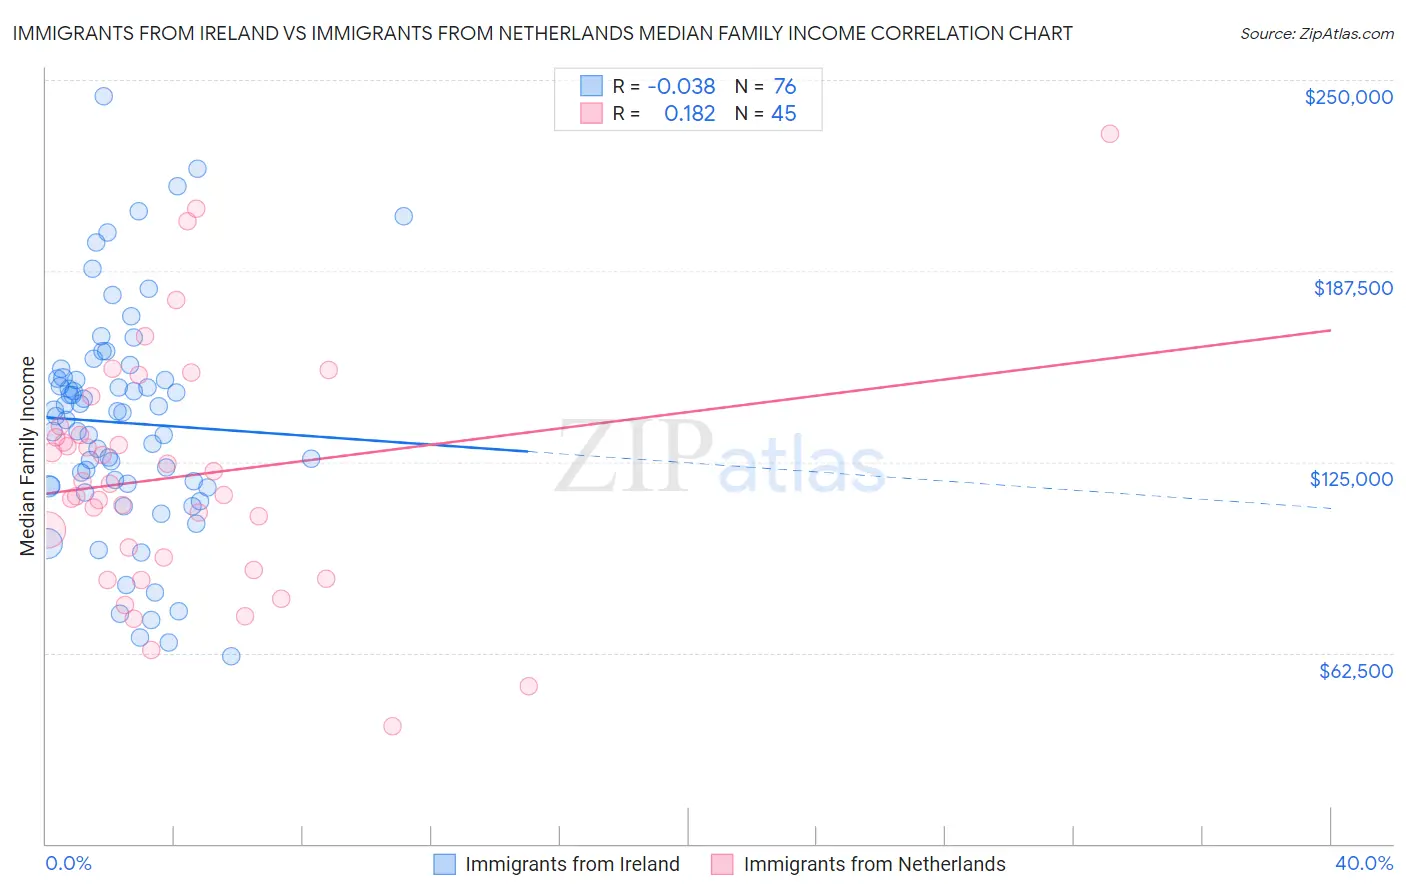
Immigrants from Ireland vs Immigrants from Netherlands Median Family Income Correlation Chart
The statistical analysis conducted on geographies consisting of 240,734,590 people shows no correlation between the proportion of Immigrants from Ireland and median family income in the United States with a correlation coefficient (R) of -0.038 and weighted average of $127,584. Similarly, the statistical analysis conducted on geographies consisting of 237,758,558 people shows a poor positive correlation between the proportion of Immigrants from Netherlands and median family income in the United States with a correlation coefficient (R) of 0.182 and weighted average of $114,987, a difference of 11.0%.
Median Family Income Correlation Summary
| Measurement | Immigrants from Ireland | Immigrants from Netherlands |
| Minimum | $61,250 | $38,500 |
| Maximum | $244,785 | $232,557 |
| Range | $183,535 | $194,057 |
| Mean | $137,790 | $120,210 |
| Median | $140,594 | $117,794 |
| Interquartile 25% (IQ1) | $117,130 | $91,744 |
| Interquartile 75% (IQ3) | $152,367 | $135,100 |
| Interquartile Range (IQR) | $35,237 | $43,356 |
| Standard Deviation (Sample) | $36,818 | $39,370 |
| Standard Deviation (Population) | $36,575 | $38,930 |
Similar Demographics by Median Family Income
Demographics Similar to Immigrants from Ireland by Median Family Income
In terms of median family income, the demographic groups most similar to Immigrants from Ireland are Immigrants from Israel ($127,430, a difference of 0.12%), Cypriot ($127,064, a difference of 0.41%), Immigrants from Australia ($126,620, a difference of 0.76%), Immigrants from South Central Asia ($125,956, a difference of 1.3%), and Eastern European ($125,546, a difference of 1.6%).
| Demographics | Rating | Rank | Median Family Income |
| Immigrants | Singapore | 100.0 /100 | #3 | Exceptional $134,818 |
| Immigrants | India | 100.0 /100 | #4 | Exceptional $134,028 |
| Iranians | 100.0 /100 | #5 | Exceptional $133,839 |
| Thais | 100.0 /100 | #6 | Exceptional $131,281 |
| Immigrants | Hong Kong | 100.0 /100 | #7 | Exceptional $131,067 |
| Immigrants | Iran | 100.0 /100 | #8 | Exceptional $130,894 |
| Okinawans | 100.0 /100 | #9 | Exceptional $129,979 |
| Immigrants | Ireland | 100.0 /100 | #10 | Exceptional $127,584 |
| Immigrants | Israel | 100.0 /100 | #11 | Exceptional $127,430 |
| Cypriots | 100.0 /100 | #12 | Exceptional $127,064 |
| Immigrants | Australia | 100.0 /100 | #13 | Exceptional $126,620 |
| Immigrants | South Central Asia | 100.0 /100 | #14 | Exceptional $125,956 |
| Eastern Europeans | 100.0 /100 | #15 | Exceptional $125,546 |
| Immigrants | China | 100.0 /100 | #16 | Exceptional $125,540 |
| Indians (Asian) | 100.0 /100 | #17 | Exceptional $125,312 |
Demographics Similar to Immigrants from Netherlands by Median Family Income
In terms of median family income, the demographic groups most similar to Immigrants from Netherlands are Immigrants from Latvia ($114,826, a difference of 0.14%), Immigrants from Indonesia ($115,162, a difference of 0.15%), Greek ($115,192, a difference of 0.18%), New Zealander ($115,230, a difference of 0.21%), and Lithuanian ($115,395, a difference of 0.35%).
| Demographics | Rating | Rank | Median Family Income |
| Maltese | 99.9 /100 | #52 | Exceptional $115,862 |
| Immigrants | Norway | 99.9 /100 | #53 | Exceptional $115,847 |
| Immigrants | Europe | 99.9 /100 | #54 | Exceptional $115,523 |
| Lithuanians | 99.8 /100 | #55 | Exceptional $115,395 |
| New Zealanders | 99.8 /100 | #56 | Exceptional $115,230 |
| Greeks | 99.8 /100 | #57 | Exceptional $115,192 |
| Immigrants | Indonesia | 99.8 /100 | #58 | Exceptional $115,162 |
| Immigrants | Netherlands | 99.8 /100 | #59 | Exceptional $114,987 |
| Immigrants | Latvia | 99.8 /100 | #60 | Exceptional $114,826 |
| Immigrants | Belarus | 99.8 /100 | #61 | Exceptional $114,586 |
| Mongolians | 99.8 /100 | #62 | Exceptional $114,553 |
| Immigrants | Pakistan | 99.8 /100 | #63 | Exceptional $114,406 |
| Immigrants | Scotland | 99.7 /100 | #64 | Exceptional $114,392 |
| Egyptians | 99.7 /100 | #65 | Exceptional $114,119 |
| Paraguayans | 99.7 /100 | #66 | Exceptional $114,016 |