Immigrants from North America vs Immigrants from Netherlands Median Family Income
COMPARE
Immigrants from North America
Immigrants from Netherlands
Median Family Income
Median Family Income Comparison
Immigrants from North America
Immigrants from Netherlands
$112,151
MEDIAN FAMILY INCOME
99.2/ 100
METRIC RATING
81st/ 347
METRIC RANK
$114,987
MEDIAN FAMILY INCOME
99.8/ 100
METRIC RATING
59th/ 347
METRIC RANK
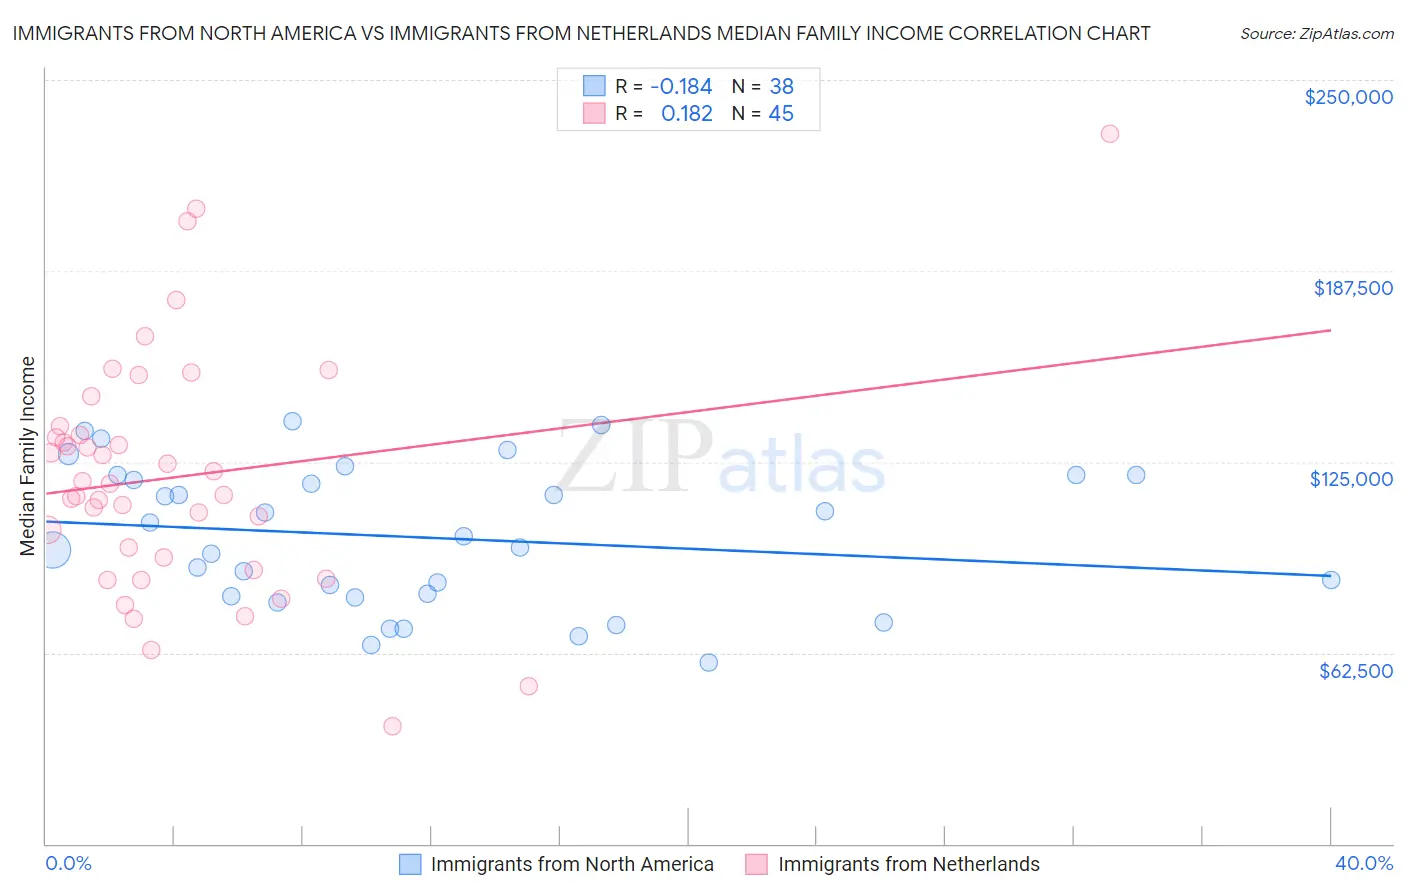
Immigrants from North America vs Immigrants from Netherlands Median Family Income Correlation Chart
The statistical analysis conducted on geographies consisting of 462,006,603 people shows a poor negative correlation between the proportion of Immigrants from North America and median family income in the United States with a correlation coefficient (R) of -0.184 and weighted average of $112,151. Similarly, the statistical analysis conducted on geographies consisting of 237,758,558 people shows a poor positive correlation between the proportion of Immigrants from Netherlands and median family income in the United States with a correlation coefficient (R) of 0.182 and weighted average of $114,987, a difference of 2.5%.
Median Family Income Correlation Summary
| Measurement | Immigrants from North America | Immigrants from Netherlands |
| Minimum | $59,444 | $38,500 |
| Maximum | $138,302 | $232,557 |
| Range | $78,858 | $194,057 |
| Mean | $100,295 | $120,210 |
| Median | $98,848 | $117,794 |
| Interquartile 25% (IQ1) | $81,159 | $91,744 |
| Interquartile 75% (IQ3) | $120,703 | $135,100 |
| Interquartile Range (IQR) | $39,544 | $43,356 |
| Standard Deviation (Sample) | $23,025 | $39,370 |
| Standard Deviation (Population) | $22,720 | $38,930 |
Similar Demographics by Median Family Income
Demographics Similar to Immigrants from North America by Median Family Income
In terms of median family income, the demographic groups most similar to Immigrants from North America are Immigrants from England ($112,038, a difference of 0.10%), Immigrants from Croatia ($112,323, a difference of 0.15%), Immigrants from Canada ($112,374, a difference of 0.20%), Italian ($112,372, a difference of 0.20%), and Immigrants from Eastern Europe ($112,527, a difference of 0.33%).
| Demographics | Rating | Rank | Median Family Income |
| Immigrants | Italy | 99.4 /100 | #74 | Exceptional $112,848 |
| Immigrants | Western Europe | 99.4 /100 | #75 | Exceptional $112,688 |
| Argentineans | 99.4 /100 | #76 | Exceptional $112,665 |
| Immigrants | Eastern Europe | 99.4 /100 | #77 | Exceptional $112,527 |
| Immigrants | Canada | 99.3 /100 | #78 | Exceptional $112,374 |
| Italians | 99.3 /100 | #79 | Exceptional $112,372 |
| Immigrants | Croatia | 99.3 /100 | #80 | Exceptional $112,323 |
| Immigrants | North America | 99.2 /100 | #81 | Exceptional $112,151 |
| Immigrants | England | 99.2 /100 | #82 | Exceptional $112,038 |
| Immigrants | Egypt | 99.0 /100 | #83 | Exceptional $111,689 |
| Immigrants | Hungary | 98.8 /100 | #84 | Exceptional $111,378 |
| Croatians | 98.8 /100 | #85 | Exceptional $111,370 |
| Ukrainians | 98.8 /100 | #86 | Exceptional $111,368 |
| Austrians | 98.8 /100 | #87 | Exceptional $111,306 |
| Romanians | 98.8 /100 | #88 | Exceptional $111,243 |
Demographics Similar to Immigrants from Netherlands by Median Family Income
In terms of median family income, the demographic groups most similar to Immigrants from Netherlands are Immigrants from Latvia ($114,826, a difference of 0.14%), Immigrants from Indonesia ($115,162, a difference of 0.15%), Greek ($115,192, a difference of 0.18%), New Zealander ($115,230, a difference of 0.21%), and Lithuanian ($115,395, a difference of 0.35%).
| Demographics | Rating | Rank | Median Family Income |
| Maltese | 99.9 /100 | #52 | Exceptional $115,862 |
| Immigrants | Norway | 99.9 /100 | #53 | Exceptional $115,847 |
| Immigrants | Europe | 99.9 /100 | #54 | Exceptional $115,523 |
| Lithuanians | 99.8 /100 | #55 | Exceptional $115,395 |
| New Zealanders | 99.8 /100 | #56 | Exceptional $115,230 |
| Greeks | 99.8 /100 | #57 | Exceptional $115,192 |
| Immigrants | Indonesia | 99.8 /100 | #58 | Exceptional $115,162 |
| Immigrants | Netherlands | 99.8 /100 | #59 | Exceptional $114,987 |
| Immigrants | Latvia | 99.8 /100 | #60 | Exceptional $114,826 |
| Immigrants | Belarus | 99.8 /100 | #61 | Exceptional $114,586 |
| Mongolians | 99.8 /100 | #62 | Exceptional $114,553 |
| Immigrants | Pakistan | 99.8 /100 | #63 | Exceptional $114,406 |
| Immigrants | Scotland | 99.7 /100 | #64 | Exceptional $114,392 |
| Egyptians | 99.7 /100 | #65 | Exceptional $114,119 |
| Paraguayans | 99.7 /100 | #66 | Exceptional $114,016 |