Ukrainian vs Immigrants from Netherlands Median Family Income
COMPARE
Ukrainian
Immigrants from Netherlands
Median Family Income
Median Family Income Comparison
Ukrainians
Immigrants from Netherlands
$111,368
MEDIAN FAMILY INCOME
98.8/ 100
METRIC RATING
86th/ 347
METRIC RANK
$114,987
MEDIAN FAMILY INCOME
99.8/ 100
METRIC RATING
59th/ 347
METRIC RANK
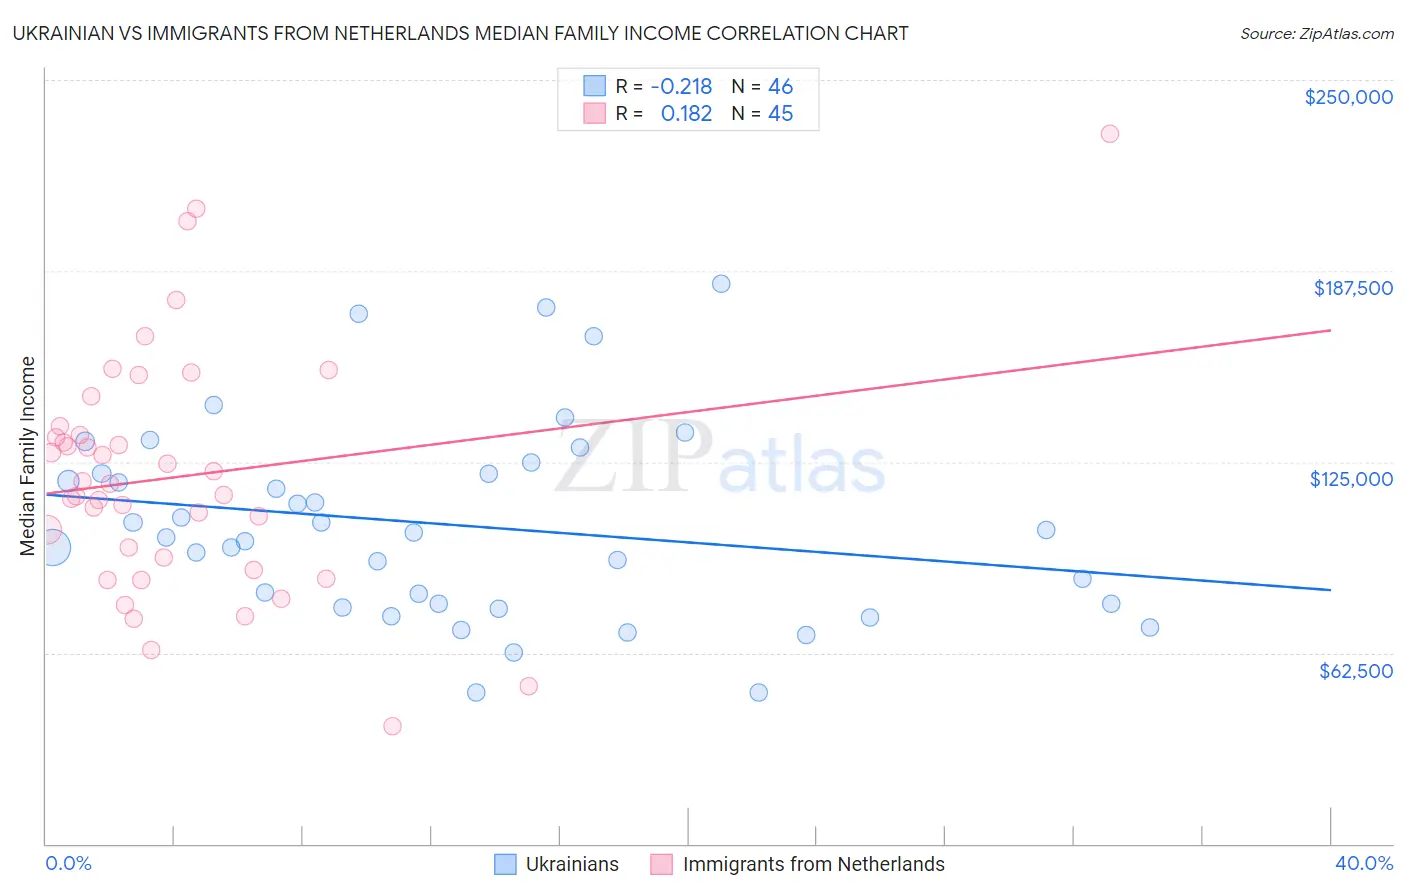
Ukrainian vs Immigrants from Netherlands Median Family Income Correlation Chart
The statistical analysis conducted on geographies consisting of 448,126,657 people shows a weak negative correlation between the proportion of Ukrainians and median family income in the United States with a correlation coefficient (R) of -0.218 and weighted average of $111,368. Similarly, the statistical analysis conducted on geographies consisting of 237,758,558 people shows a poor positive correlation between the proportion of Immigrants from Netherlands and median family income in the United States with a correlation coefficient (R) of 0.182 and weighted average of $114,987, a difference of 3.3%.
Median Family Income Correlation Summary
| Measurement | Ukrainian | Immigrants from Netherlands |
| Minimum | $49,418 | $38,500 |
| Maximum | $183,477 | $232,557 |
| Range | $134,059 | $194,057 |
| Mean | $104,354 | $120,210 |
| Median | $101,148 | $117,794 |
| Interquartile 25% (IQ1) | $78,581 | $91,744 |
| Interquartile 75% (IQ3) | $121,262 | $135,100 |
| Interquartile Range (IQR) | $42,681 | $43,356 |
| Standard Deviation (Sample) | $32,156 | $39,370 |
| Standard Deviation (Population) | $31,804 | $38,930 |
Similar Demographics by Median Family Income
Demographics Similar to Ukrainians by Median Family Income
In terms of median family income, the demographic groups most similar to Ukrainians are Croatian ($111,370, a difference of 0.0%), Immigrants from Hungary ($111,378, a difference of 0.010%), Austrian ($111,306, a difference of 0.060%), Romanian ($111,243, a difference of 0.11%), and Immigrants from Egypt ($111,689, a difference of 0.29%).
| Demographics | Rating | Rank | Median Family Income |
| Italians | 99.3 /100 | #79 | Exceptional $112,372 |
| Immigrants | Croatia | 99.3 /100 | #80 | Exceptional $112,323 |
| Immigrants | North America | 99.2 /100 | #81 | Exceptional $112,151 |
| Immigrants | England | 99.2 /100 | #82 | Exceptional $112,038 |
| Immigrants | Egypt | 99.0 /100 | #83 | Exceptional $111,689 |
| Immigrants | Hungary | 98.8 /100 | #84 | Exceptional $111,378 |
| Croatians | 98.8 /100 | #85 | Exceptional $111,370 |
| Ukrainians | 98.8 /100 | #86 | Exceptional $111,368 |
| Austrians | 98.8 /100 | #87 | Exceptional $111,306 |
| Romanians | 98.8 /100 | #88 | Exceptional $111,243 |
| Immigrants | Argentina | 98.5 /100 | #89 | Exceptional $110,873 |
| Northern Europeans | 98.3 /100 | #90 | Exceptional $110,635 |
| Immigrants | Southern Europe | 98.3 /100 | #91 | Exceptional $110,614 |
| Immigrants | Lebanon | 97.9 /100 | #92 | Exceptional $110,159 |
| Immigrants | Kazakhstan | 97.8 /100 | #93 | Exceptional $110,137 |
Demographics Similar to Immigrants from Netherlands by Median Family Income
In terms of median family income, the demographic groups most similar to Immigrants from Netherlands are Immigrants from Latvia ($114,826, a difference of 0.14%), Immigrants from Indonesia ($115,162, a difference of 0.15%), Greek ($115,192, a difference of 0.18%), New Zealander ($115,230, a difference of 0.21%), and Lithuanian ($115,395, a difference of 0.35%).
| Demographics | Rating | Rank | Median Family Income |
| Maltese | 99.9 /100 | #52 | Exceptional $115,862 |
| Immigrants | Norway | 99.9 /100 | #53 | Exceptional $115,847 |
| Immigrants | Europe | 99.9 /100 | #54 | Exceptional $115,523 |
| Lithuanians | 99.8 /100 | #55 | Exceptional $115,395 |
| New Zealanders | 99.8 /100 | #56 | Exceptional $115,230 |
| Greeks | 99.8 /100 | #57 | Exceptional $115,192 |
| Immigrants | Indonesia | 99.8 /100 | #58 | Exceptional $115,162 |
| Immigrants | Netherlands | 99.8 /100 | #59 | Exceptional $114,987 |
| Immigrants | Latvia | 99.8 /100 | #60 | Exceptional $114,826 |
| Immigrants | Belarus | 99.8 /100 | #61 | Exceptional $114,586 |
| Mongolians | 99.8 /100 | #62 | Exceptional $114,553 |
| Immigrants | Pakistan | 99.8 /100 | #63 | Exceptional $114,406 |
| Immigrants | Scotland | 99.7 /100 | #64 | Exceptional $114,392 |
| Egyptians | 99.7 /100 | #65 | Exceptional $114,119 |
| Paraguayans | 99.7 /100 | #66 | Exceptional $114,016 |