Scottish vs Comanche Median Family Income
COMPARE
Scottish
Comanche
Median Family Income
Median Family Income Comparison
Scottish
Comanche
$104,288
MEDIAN FAMILY INCOME
69.5/ 100
METRIC RATING
160th/ 347
METRIC RANK
$88,556
MEDIAN FAMILY INCOME
0.1/ 100
METRIC RATING
282nd/ 347
METRIC RANK
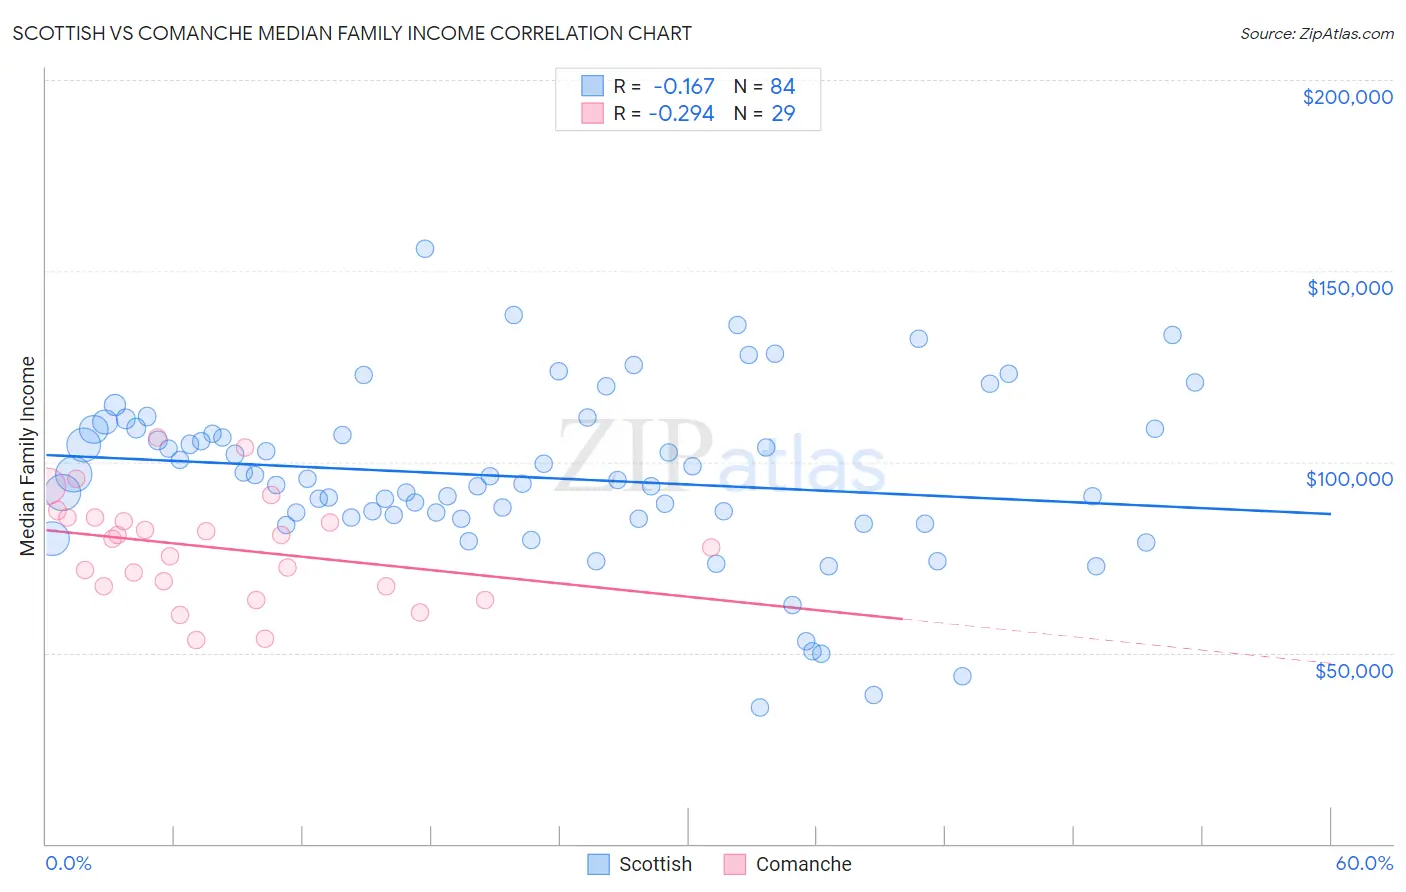
Scottish vs Comanche Median Family Income Correlation Chart
The statistical analysis conducted on geographies consisting of 565,809,702 people shows a poor negative correlation between the proportion of Scottish and median family income in the United States with a correlation coefficient (R) of -0.167 and weighted average of $104,288. Similarly, the statistical analysis conducted on geographies consisting of 109,751,078 people shows a weak negative correlation between the proportion of Comanche and median family income in the United States with a correlation coefficient (R) of -0.294 and weighted average of $88,556, a difference of 17.8%.
Median Family Income Correlation Summary
| Measurement | Scottish | Comanche |
| Minimum | $35,833 | $53,472 |
| Maximum | $155,822 | $106,375 |
| Range | $119,989 | $52,903 |
| Mean | $95,991 | $77,578 |
| Median | $95,418 | $79,900 |
| Interquartile 25% (IQ1) | $85,332 | $67,370 |
| Interquartile 75% (IQ3) | $108,630 | $85,455 |
| Interquartile Range (IQR) | $23,298 | $18,086 |
| Standard Deviation (Sample) | $22,327 | $13,620 |
| Standard Deviation (Population) | $22,194 | $13,383 |
Similar Demographics by Median Family Income
Demographics Similar to Scottish by Median Family Income
In terms of median family income, the demographic groups most similar to Scottish are Icelander ($104,282, a difference of 0.010%), Swiss ($104,396, a difference of 0.10%), Scandinavian ($104,410, a difference of 0.12%), Moroccan ($104,488, a difference of 0.19%), and Immigrants from Sierra Leone ($103,990, a difference of 0.29%).
| Demographics | Rating | Rank | Median Family Income |
| Slavs | 77.9 /100 | #153 | Good $105,144 |
| Immigrants | Nepal | 76.3 /100 | #154 | Good $104,966 |
| Native Hawaiians | 75.8 /100 | #155 | Good $104,910 |
| Basques | 74.4 /100 | #156 | Good $104,760 |
| Moroccans | 71.6 /100 | #157 | Good $104,488 |
| Scandinavians | 70.8 /100 | #158 | Good $104,410 |
| Swiss | 70.7 /100 | #159 | Good $104,396 |
| Scottish | 69.5 /100 | #160 | Good $104,288 |
| Icelanders | 69.4 /100 | #161 | Good $104,282 |
| Immigrants | Sierra Leone | 66.2 /100 | #162 | Good $103,990 |
| Costa Ricans | 66.2 /100 | #163 | Good $103,989 |
| Sierra Leoneans | 64.7 /100 | #164 | Good $103,859 |
| Slovaks | 63.1 /100 | #165 | Good $103,729 |
| English | 62.6 /100 | #166 | Good $103,684 |
| South American Indians | 61.9 /100 | #167 | Good $103,624 |
Demographics Similar to Comanche by Median Family Income
In terms of median family income, the demographic groups most similar to Comanche are Blackfeet ($88,717, a difference of 0.18%), Bangladeshi ($88,358, a difference of 0.22%), Indonesian ($88,301, a difference of 0.29%), Guatemalan ($88,295, a difference of 0.29%), and Immigrants from Nicaragua ($88,267, a difference of 0.33%).
| Demographics | Rating | Rank | Median Family Income |
| Immigrants | St. Vincent and the Grenadines | 0.2 /100 | #275 | Tragic $90,094 |
| Immigrants | Zaire | 0.1 /100 | #276 | Tragic $89,285 |
| Immigrants | Jamaica | 0.1 /100 | #277 | Tragic $89,268 |
| Immigrants | Grenada | 0.1 /100 | #278 | Tragic $89,249 |
| Immigrants | Belize | 0.1 /100 | #279 | Tragic $89,197 |
| British West Indians | 0.1 /100 | #280 | Tragic $88,987 |
| Blackfeet | 0.1 /100 | #281 | Tragic $88,717 |
| Comanche | 0.1 /100 | #282 | Tragic $88,556 |
| Bangladeshis | 0.1 /100 | #283 | Tragic $88,358 |
| Indonesians | 0.1 /100 | #284 | Tragic $88,301 |
| Guatemalans | 0.1 /100 | #285 | Tragic $88,295 |
| Immigrants | Nicaragua | 0.1 /100 | #286 | Tragic $88,267 |
| Potawatomi | 0.1 /100 | #287 | Tragic $88,265 |
| Cherokee | 0.1 /100 | #288 | Tragic $88,209 |
| Central American Indians | 0.1 /100 | #289 | Tragic $88,034 |