Scottish vs Czechoslovakian Median Family Income
COMPARE
Scottish
Czechoslovakian
Median Family Income
Median Family Income Comparison
Scottish
Czechoslovakians
$104,288
MEDIAN FAMILY INCOME
69.5/ 100
METRIC RATING
160th/ 347
METRIC RANK
$103,273
MEDIAN FAMILY INCOME
57.6/ 100
METRIC RATING
169th/ 347
METRIC RANK
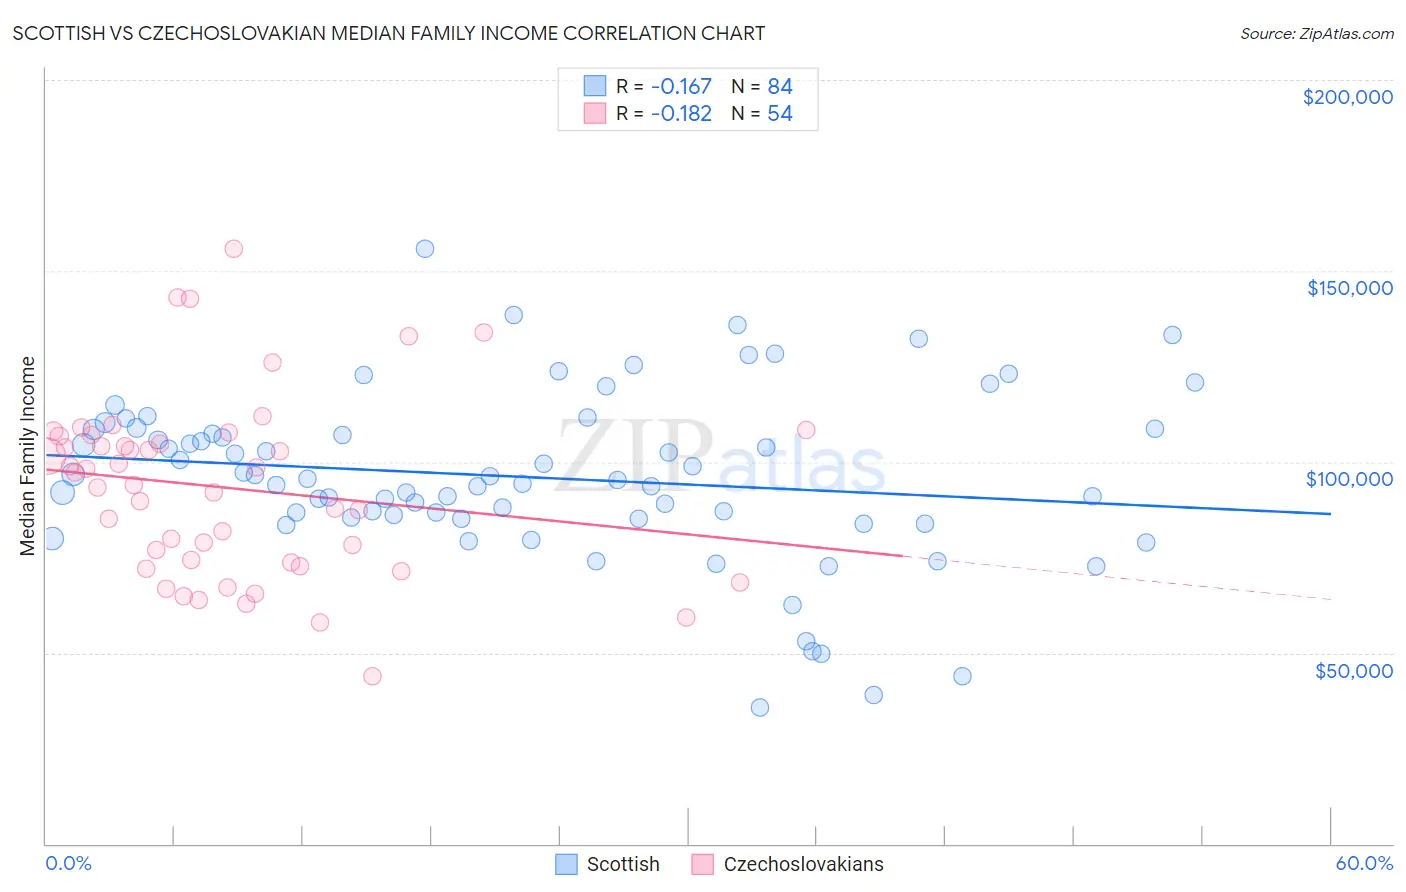
Scottish vs Czechoslovakian Median Family Income Correlation Chart
The statistical analysis conducted on geographies consisting of 565,809,702 people shows a poor negative correlation between the proportion of Scottish and median family income in the United States with a correlation coefficient (R) of -0.167 and weighted average of $104,288. Similarly, the statistical analysis conducted on geographies consisting of 368,451,092 people shows a poor negative correlation between the proportion of Czechoslovakians and median family income in the United States with a correlation coefficient (R) of -0.182 and weighted average of $103,273, a difference of 0.98%.
Median Family Income Correlation Summary
| Measurement | Scottish | Czechoslovakian |
| Minimum | $35,833 | $43,750 |
| Maximum | $155,822 | $155,917 |
| Range | $119,989 | $112,167 |
| Mean | $95,991 | $93,173 |
| Median | $95,418 | $95,488 |
| Interquartile 25% (IQ1) | $85,332 | $73,511 |
| Interquartile 75% (IQ3) | $108,630 | $106,731 |
| Interquartile Range (IQR) | $23,298 | $33,220 |
| Standard Deviation (Sample) | $22,327 | $23,604 |
| Standard Deviation (Population) | $22,194 | $23,385 |
Demographics Similar to Scottish and Czechoslovakians by Median Family Income
In terms of median family income, the demographic groups most similar to Scottish are Icelander ($104,282, a difference of 0.010%), Swiss ($104,396, a difference of 0.10%), Scandinavian ($104,410, a difference of 0.12%), Moroccan ($104,488, a difference of 0.19%), and Immigrants from Sierra Leone ($103,990, a difference of 0.29%). Similarly, the demographic groups most similar to Czechoslovakians are Immigrants from Uzbekistan ($103,197, a difference of 0.070%), Immigrants from Peru ($103,534, a difference of 0.25%), Alsatian ($103,010, a difference of 0.26%), South American Indian ($103,624, a difference of 0.34%), and English ($103,684, a difference of 0.40%).
| Demographics | Rating | Rank | Median Family Income |
| Immigrants | Nepal | 76.3 /100 | #154 | Good $104,966 |
| Native Hawaiians | 75.8 /100 | #155 | Good $104,910 |
| Basques | 74.4 /100 | #156 | Good $104,760 |
| Moroccans | 71.6 /100 | #157 | Good $104,488 |
| Scandinavians | 70.8 /100 | #158 | Good $104,410 |
| Swiss | 70.7 /100 | #159 | Good $104,396 |
| Scottish | 69.5 /100 | #160 | Good $104,288 |
| Icelanders | 69.4 /100 | #161 | Good $104,282 |
| Immigrants | Sierra Leone | 66.2 /100 | #162 | Good $103,990 |
| Costa Ricans | 66.2 /100 | #163 | Good $103,989 |
| Sierra Leoneans | 64.7 /100 | #164 | Good $103,859 |
| Slovaks | 63.1 /100 | #165 | Good $103,729 |
| English | 62.6 /100 | #166 | Good $103,684 |
| South American Indians | 61.9 /100 | #167 | Good $103,624 |
| Immigrants | Peru | 60.8 /100 | #168 | Good $103,534 |
| Czechoslovakians | 57.6 /100 | #169 | Average $103,273 |
| Immigrants | Uzbekistan | 56.6 /100 | #170 | Average $103,197 |
| Alsatians | 54.3 /100 | #171 | Average $103,010 |
| Immigrants | Eritrea | 51.9 /100 | #172 | Average $102,823 |
| Belgians | 51.4 /100 | #173 | Average $102,788 |
| Finns | 50.0 /100 | #174 | Average $102,676 |