Houma vs Immigrants from Netherlands Median Family Income
COMPARE
Houma
Immigrants from Netherlands
Median Family Income
Median Family Income Comparison
Houma
Immigrants from Netherlands
$76,188
MEDIAN FAMILY INCOME
0.0/ 100
METRIC RATING
343rd/ 347
METRIC RANK
$114,987
MEDIAN FAMILY INCOME
99.8/ 100
METRIC RATING
59th/ 347
METRIC RANK
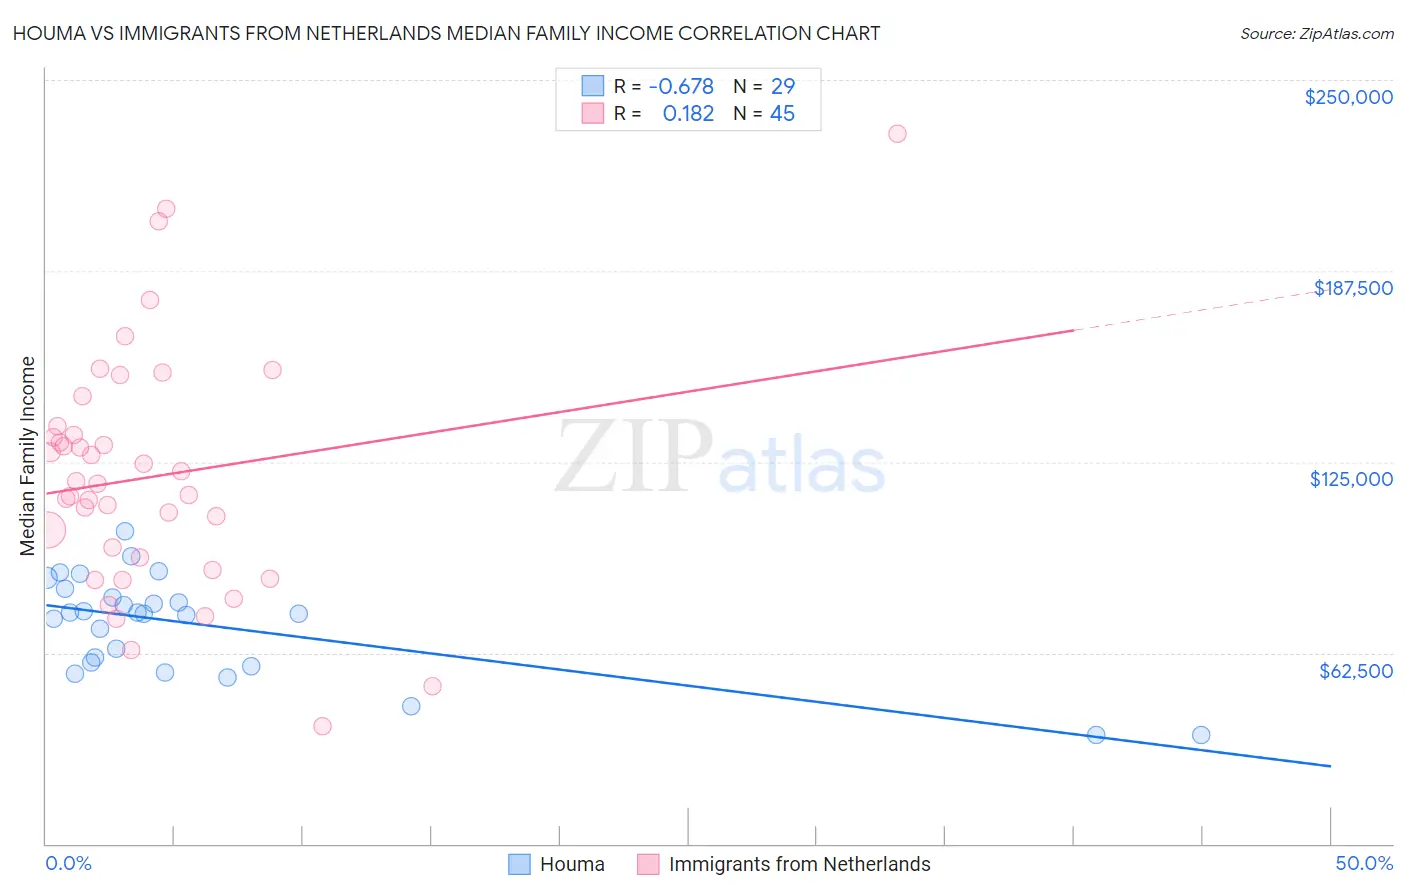
Houma vs Immigrants from Netherlands Median Family Income Correlation Chart
The statistical analysis conducted on geographies consisting of 36,790,797 people shows a significant negative correlation between the proportion of Houma and median family income in the United States with a correlation coefficient (R) of -0.678 and weighted average of $76,188. Similarly, the statistical analysis conducted on geographies consisting of 237,758,558 people shows a poor positive correlation between the proportion of Immigrants from Netherlands and median family income in the United States with a correlation coefficient (R) of 0.182 and weighted average of $114,987, a difference of 50.9%.
Median Family Income Correlation Summary
| Measurement | Houma | Immigrants from Netherlands |
| Minimum | $35,539 | $38,500 |
| Maximum | $102,344 | $232,557 |
| Range | $66,805 | $194,057 |
| Mean | $71,438 | $120,210 |
| Median | $75,379 | $117,794 |
| Interquartile 25% (IQ1) | $58,820 | $91,744 |
| Interquartile 75% (IQ3) | $82,023 | $135,100 |
| Interquartile Range (IQR) | $23,203 | $43,356 |
| Standard Deviation (Sample) | $16,513 | $39,370 |
| Standard Deviation (Population) | $16,226 | $38,930 |
Similar Demographics by Median Family Income
Demographics Similar to Houma by Median Family Income
In terms of median family income, the demographic groups most similar to Houma are Crow ($76,605, a difference of 0.55%), Pueblo ($76,880, a difference of 0.91%), Hopi ($77,188, a difference of 1.3%), Pima ($77,431, a difference of 1.6%), and Immigrants from Yemen ($77,457, a difference of 1.7%).
| Demographics | Rating | Rank | Median Family Income |
| Kiowa | 0.0 /100 | #333 | Tragic $80,885 |
| Menominee | 0.0 /100 | #334 | Tragic $79,563 |
| Yup'ik | 0.0 /100 | #335 | Tragic $79,290 |
| Immigrants | Cuba | 0.0 /100 | #336 | Tragic $78,249 |
| Yuman | 0.0 /100 | #337 | Tragic $78,055 |
| Immigrants | Yemen | 0.0 /100 | #338 | Tragic $77,457 |
| Pima | 0.0 /100 | #339 | Tragic $77,431 |
| Hopi | 0.0 /100 | #340 | Tragic $77,188 |
| Pueblo | 0.0 /100 | #341 | Tragic $76,880 |
| Crow | 0.0 /100 | #342 | Tragic $76,605 |
| Houma | 0.0 /100 | #343 | Tragic $76,188 |
| Tohono O'odham | 0.0 /100 | #344 | Tragic $72,193 |
| Navajo | 0.0 /100 | #345 | Tragic $70,989 |
| Puerto Ricans | 0.0 /100 | #346 | Tragic $70,423 |
| Lumbee | 0.0 /100 | #347 | Tragic $68,679 |
Demographics Similar to Immigrants from Netherlands by Median Family Income
In terms of median family income, the demographic groups most similar to Immigrants from Netherlands are Immigrants from Latvia ($114,826, a difference of 0.14%), Immigrants from Indonesia ($115,162, a difference of 0.15%), Greek ($115,192, a difference of 0.18%), New Zealander ($115,230, a difference of 0.21%), and Lithuanian ($115,395, a difference of 0.35%).
| Demographics | Rating | Rank | Median Family Income |
| Maltese | 99.9 /100 | #52 | Exceptional $115,862 |
| Immigrants | Norway | 99.9 /100 | #53 | Exceptional $115,847 |
| Immigrants | Europe | 99.9 /100 | #54 | Exceptional $115,523 |
| Lithuanians | 99.8 /100 | #55 | Exceptional $115,395 |
| New Zealanders | 99.8 /100 | #56 | Exceptional $115,230 |
| Greeks | 99.8 /100 | #57 | Exceptional $115,192 |
| Immigrants | Indonesia | 99.8 /100 | #58 | Exceptional $115,162 |
| Immigrants | Netherlands | 99.8 /100 | #59 | Exceptional $114,987 |
| Immigrants | Latvia | 99.8 /100 | #60 | Exceptional $114,826 |
| Immigrants | Belarus | 99.8 /100 | #61 | Exceptional $114,586 |
| Mongolians | 99.8 /100 | #62 | Exceptional $114,553 |
| Immigrants | Pakistan | 99.8 /100 | #63 | Exceptional $114,406 |
| Immigrants | Scotland | 99.7 /100 | #64 | Exceptional $114,392 |
| Egyptians | 99.7 /100 | #65 | Exceptional $114,119 |
| Paraguayans | 99.7 /100 | #66 | Exceptional $114,016 |